
24 Sep New WebHMI firmware release 4.1
We are pleased to announce the release of a new version of the WebHMI 4.1 firmware, which has a lot of useful functions:
The new firmware highlights:
- Screencast function
- Report constructor for events
- Resource analytics
- New Modbus TCP server configuration page
- HTML editor and JSON visualizer
- Links to the help site
- Better work with registers and connections
- Security improvement
- New components and much more!
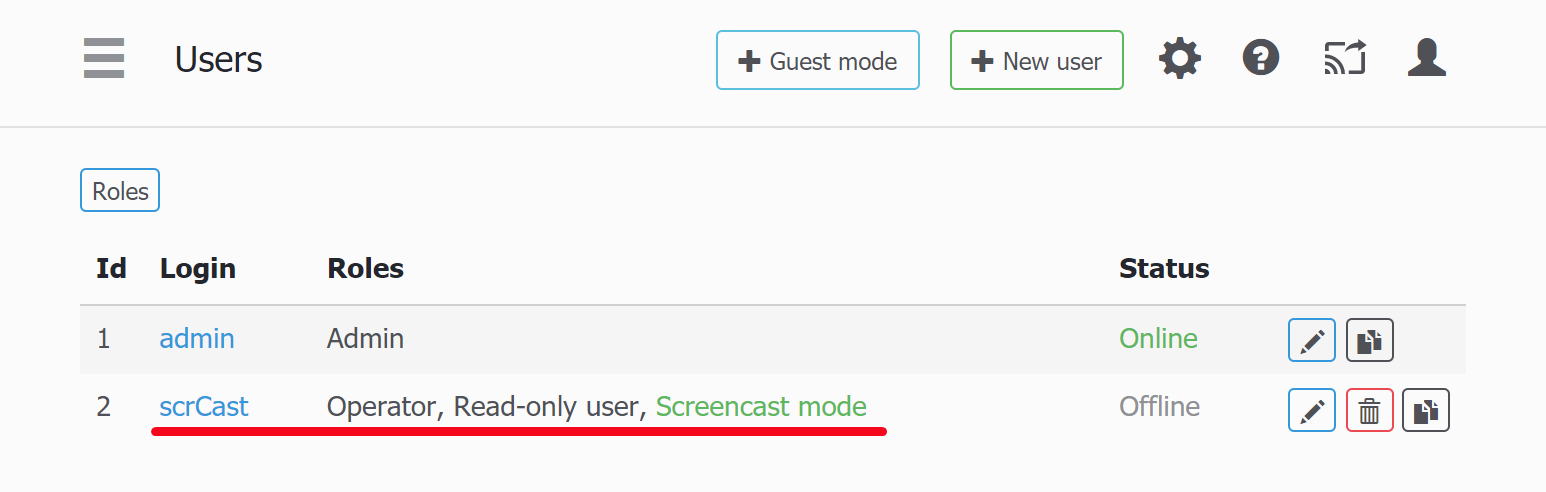
Screencast function
It is a new function which allows switching the page content (screen, dashboards, graphs, reports) for the user – either remotely or automatically by control script (using condition or schedule). This feature is very useful for managing the content of the IPTV screen, video walls or tablets used as an information table when the usual navigation through the project is inconvenient or accessible.
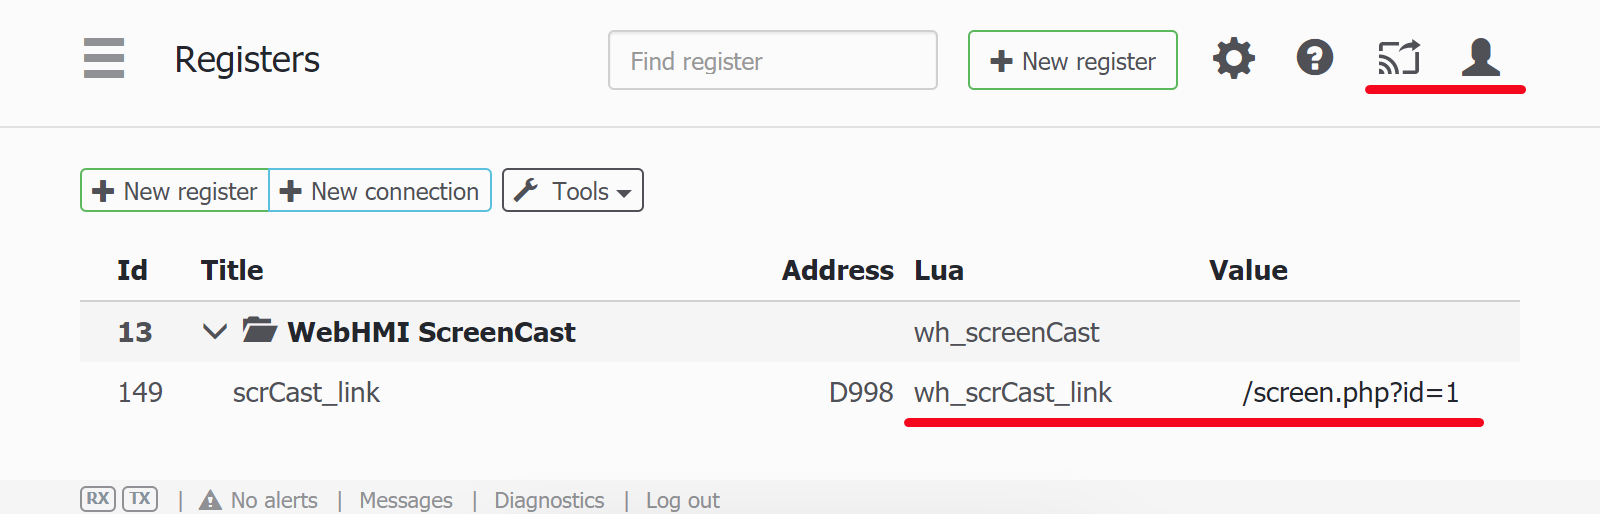
A new user is created in the system, for whom the “Screen sharing” option is set in the properties. Along with this, a new connection “WebHMI ScreenCast” will appear in the registers, with a string register “username_link”. To control the screen content for this user, it will be enough just to write a link to this register using dashboards or scripts.
In addition, the administrator can control screencast right from his interface, setting the link for the user to switch him to the required page. More information can be found
on the docs page.
Report constructor for events
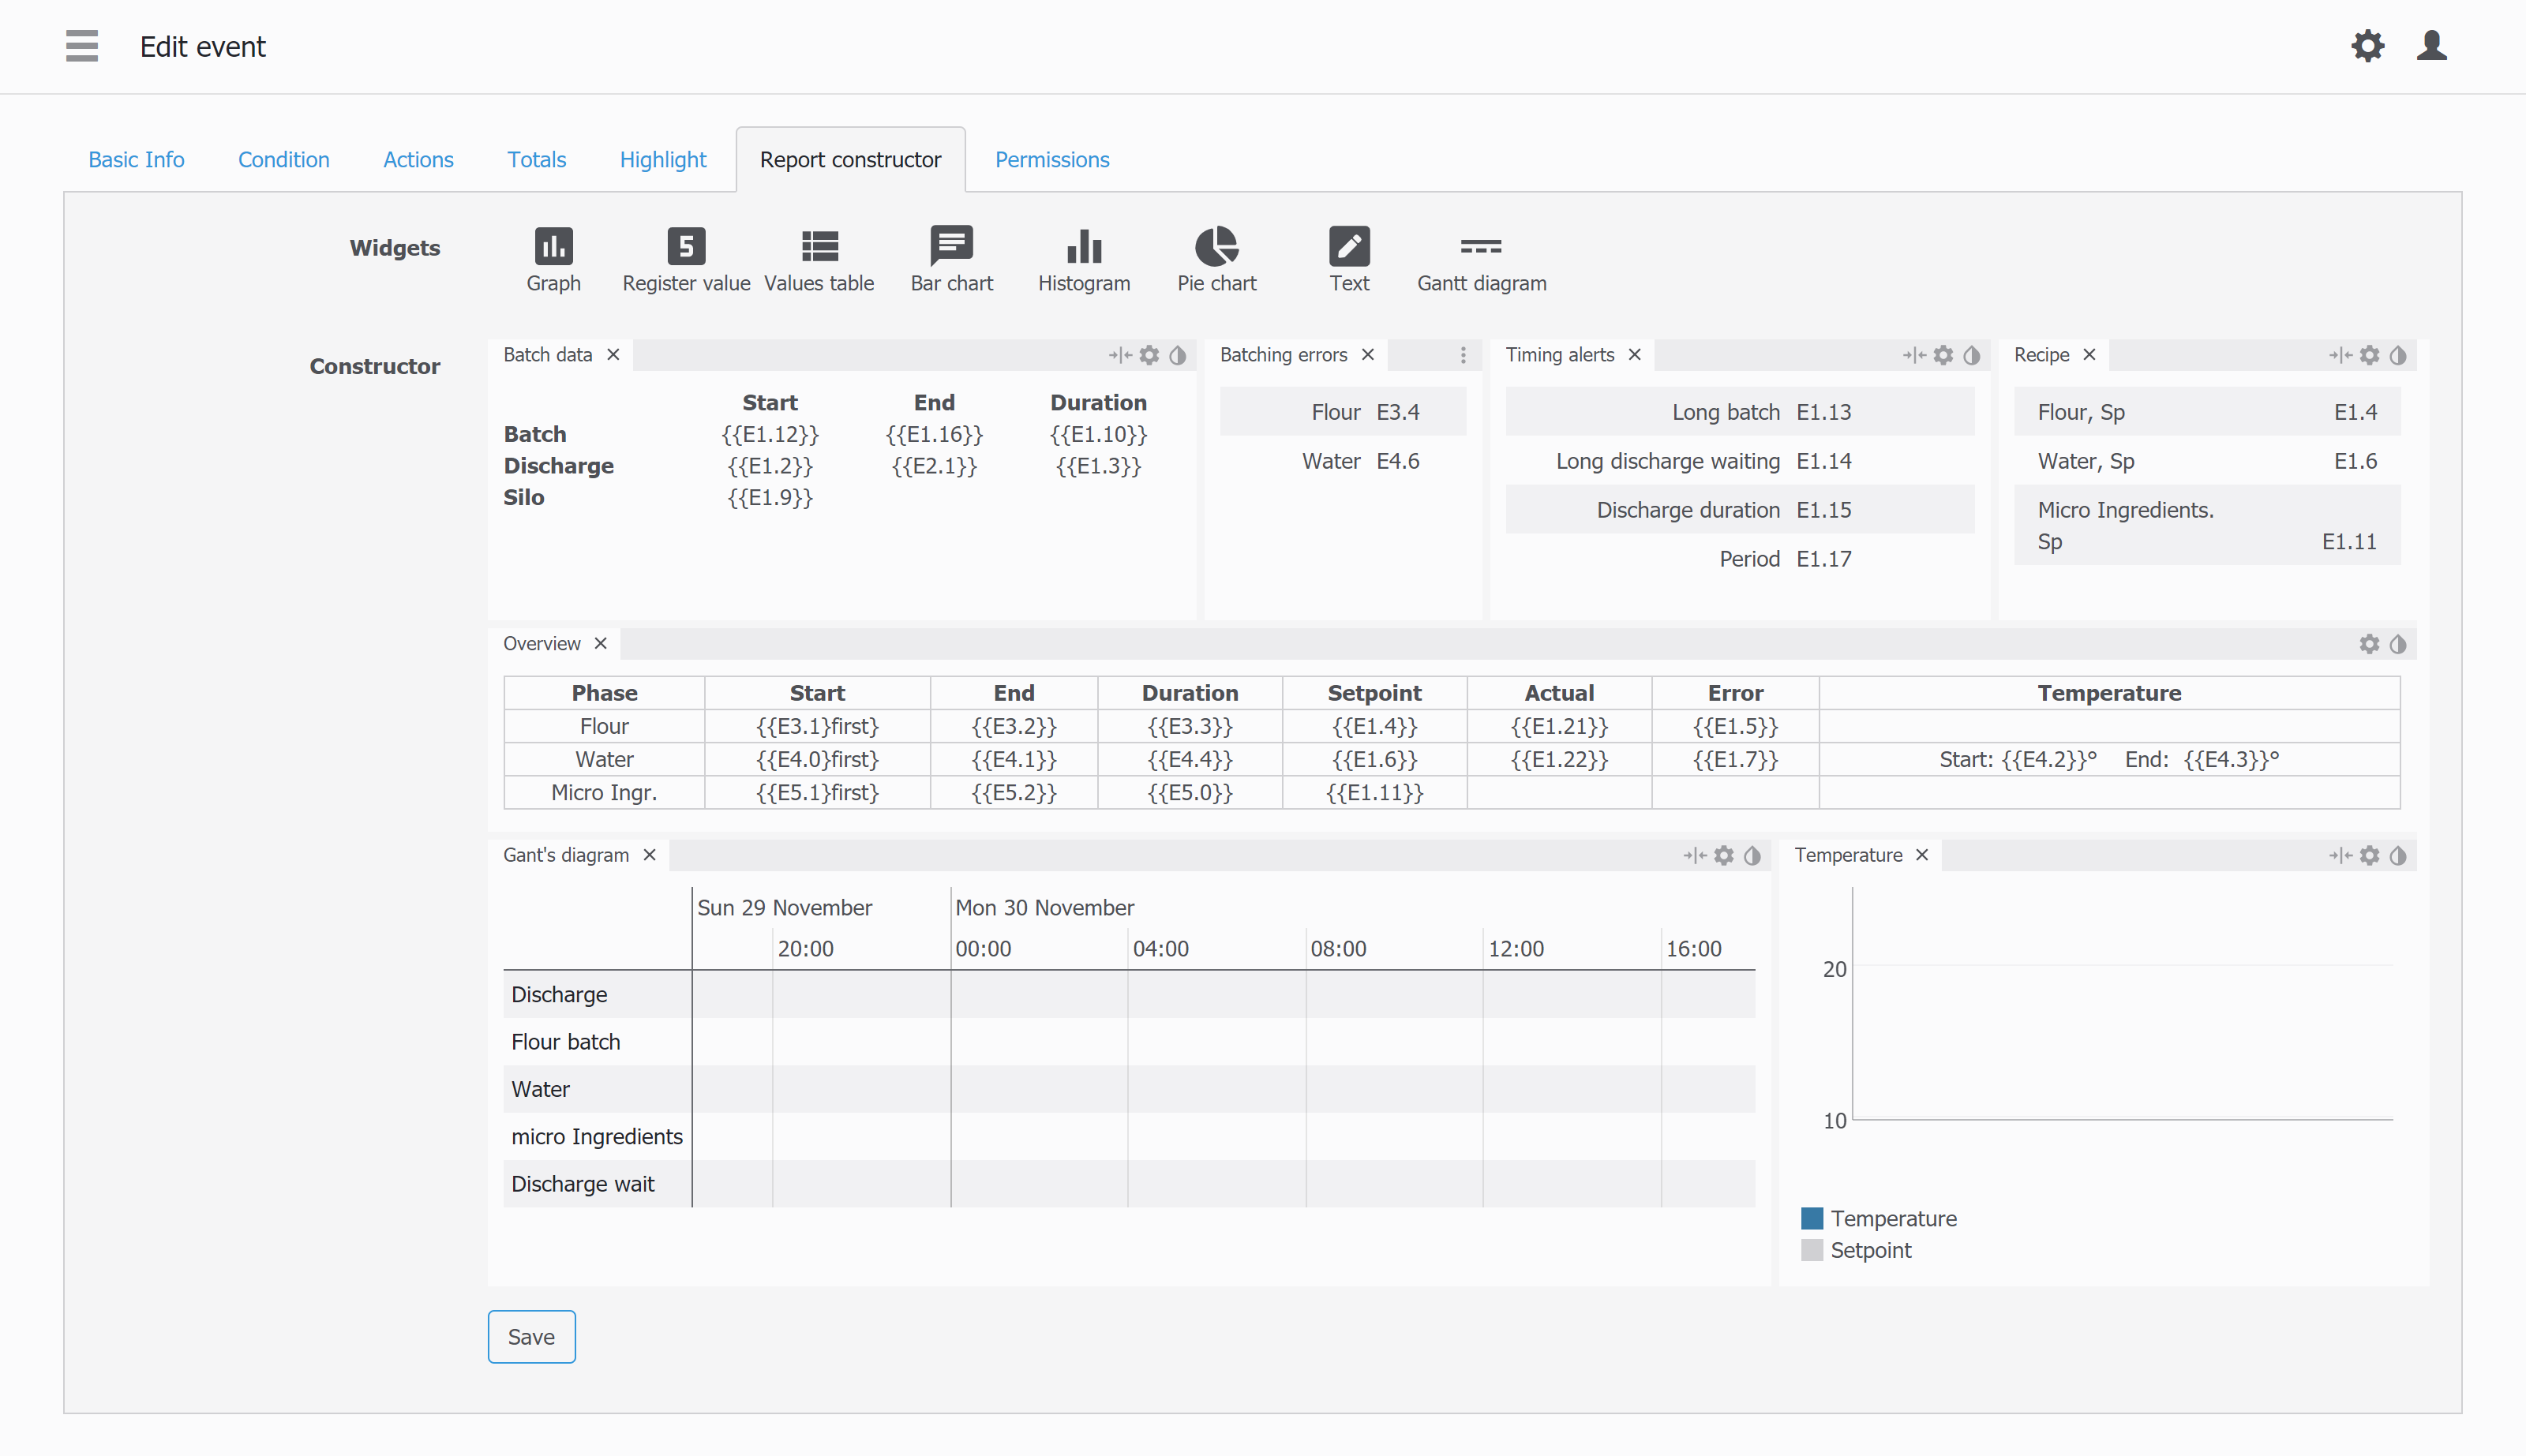
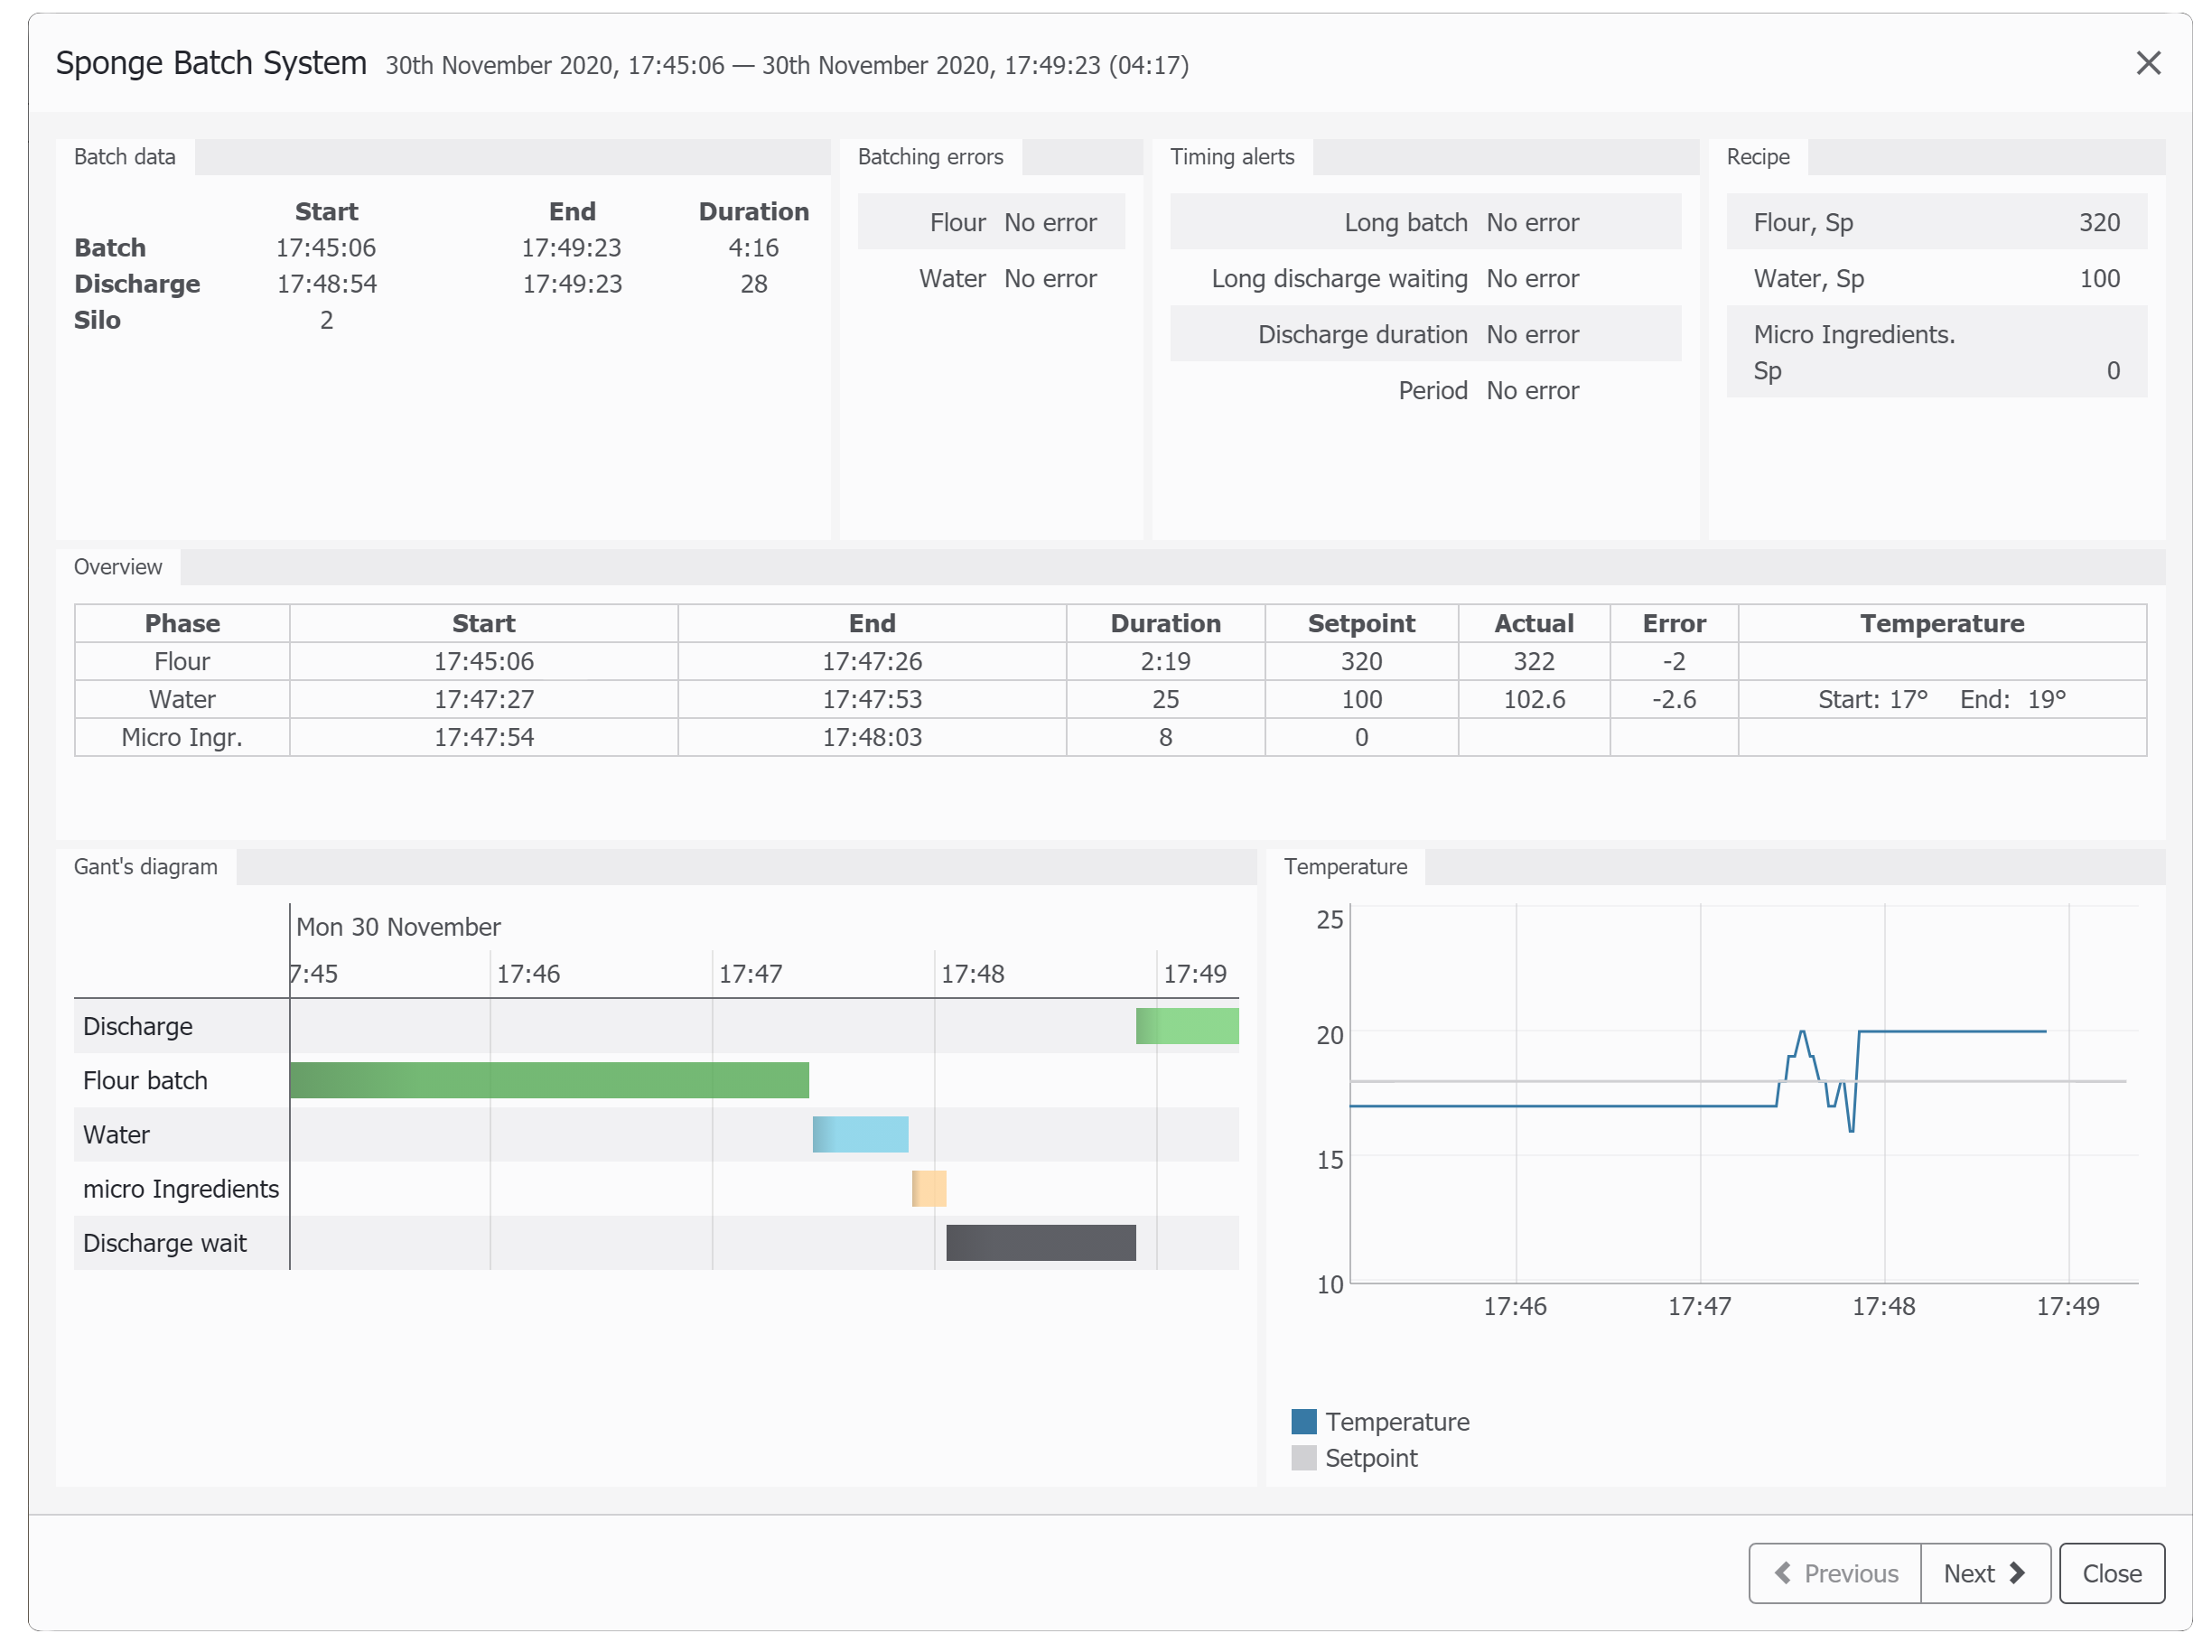
To analyze complex processes, you may need a complex and informative report. The updated firmware version has a special editor for reports, similar to the screen editor, with a difference in that it uses data from the registers stored in the event report (including reports of child events). For Gantt charts and graphs, the time interval of registration of the event itself will be used, and the data will be from the standard log.
There is a similar to screens tool set in the report constructor:
- Gantt diagrams
- Tables of values
- Graphs
- Register value
- Bar chart
- Histogram
- Pie chart
- HTML text editor
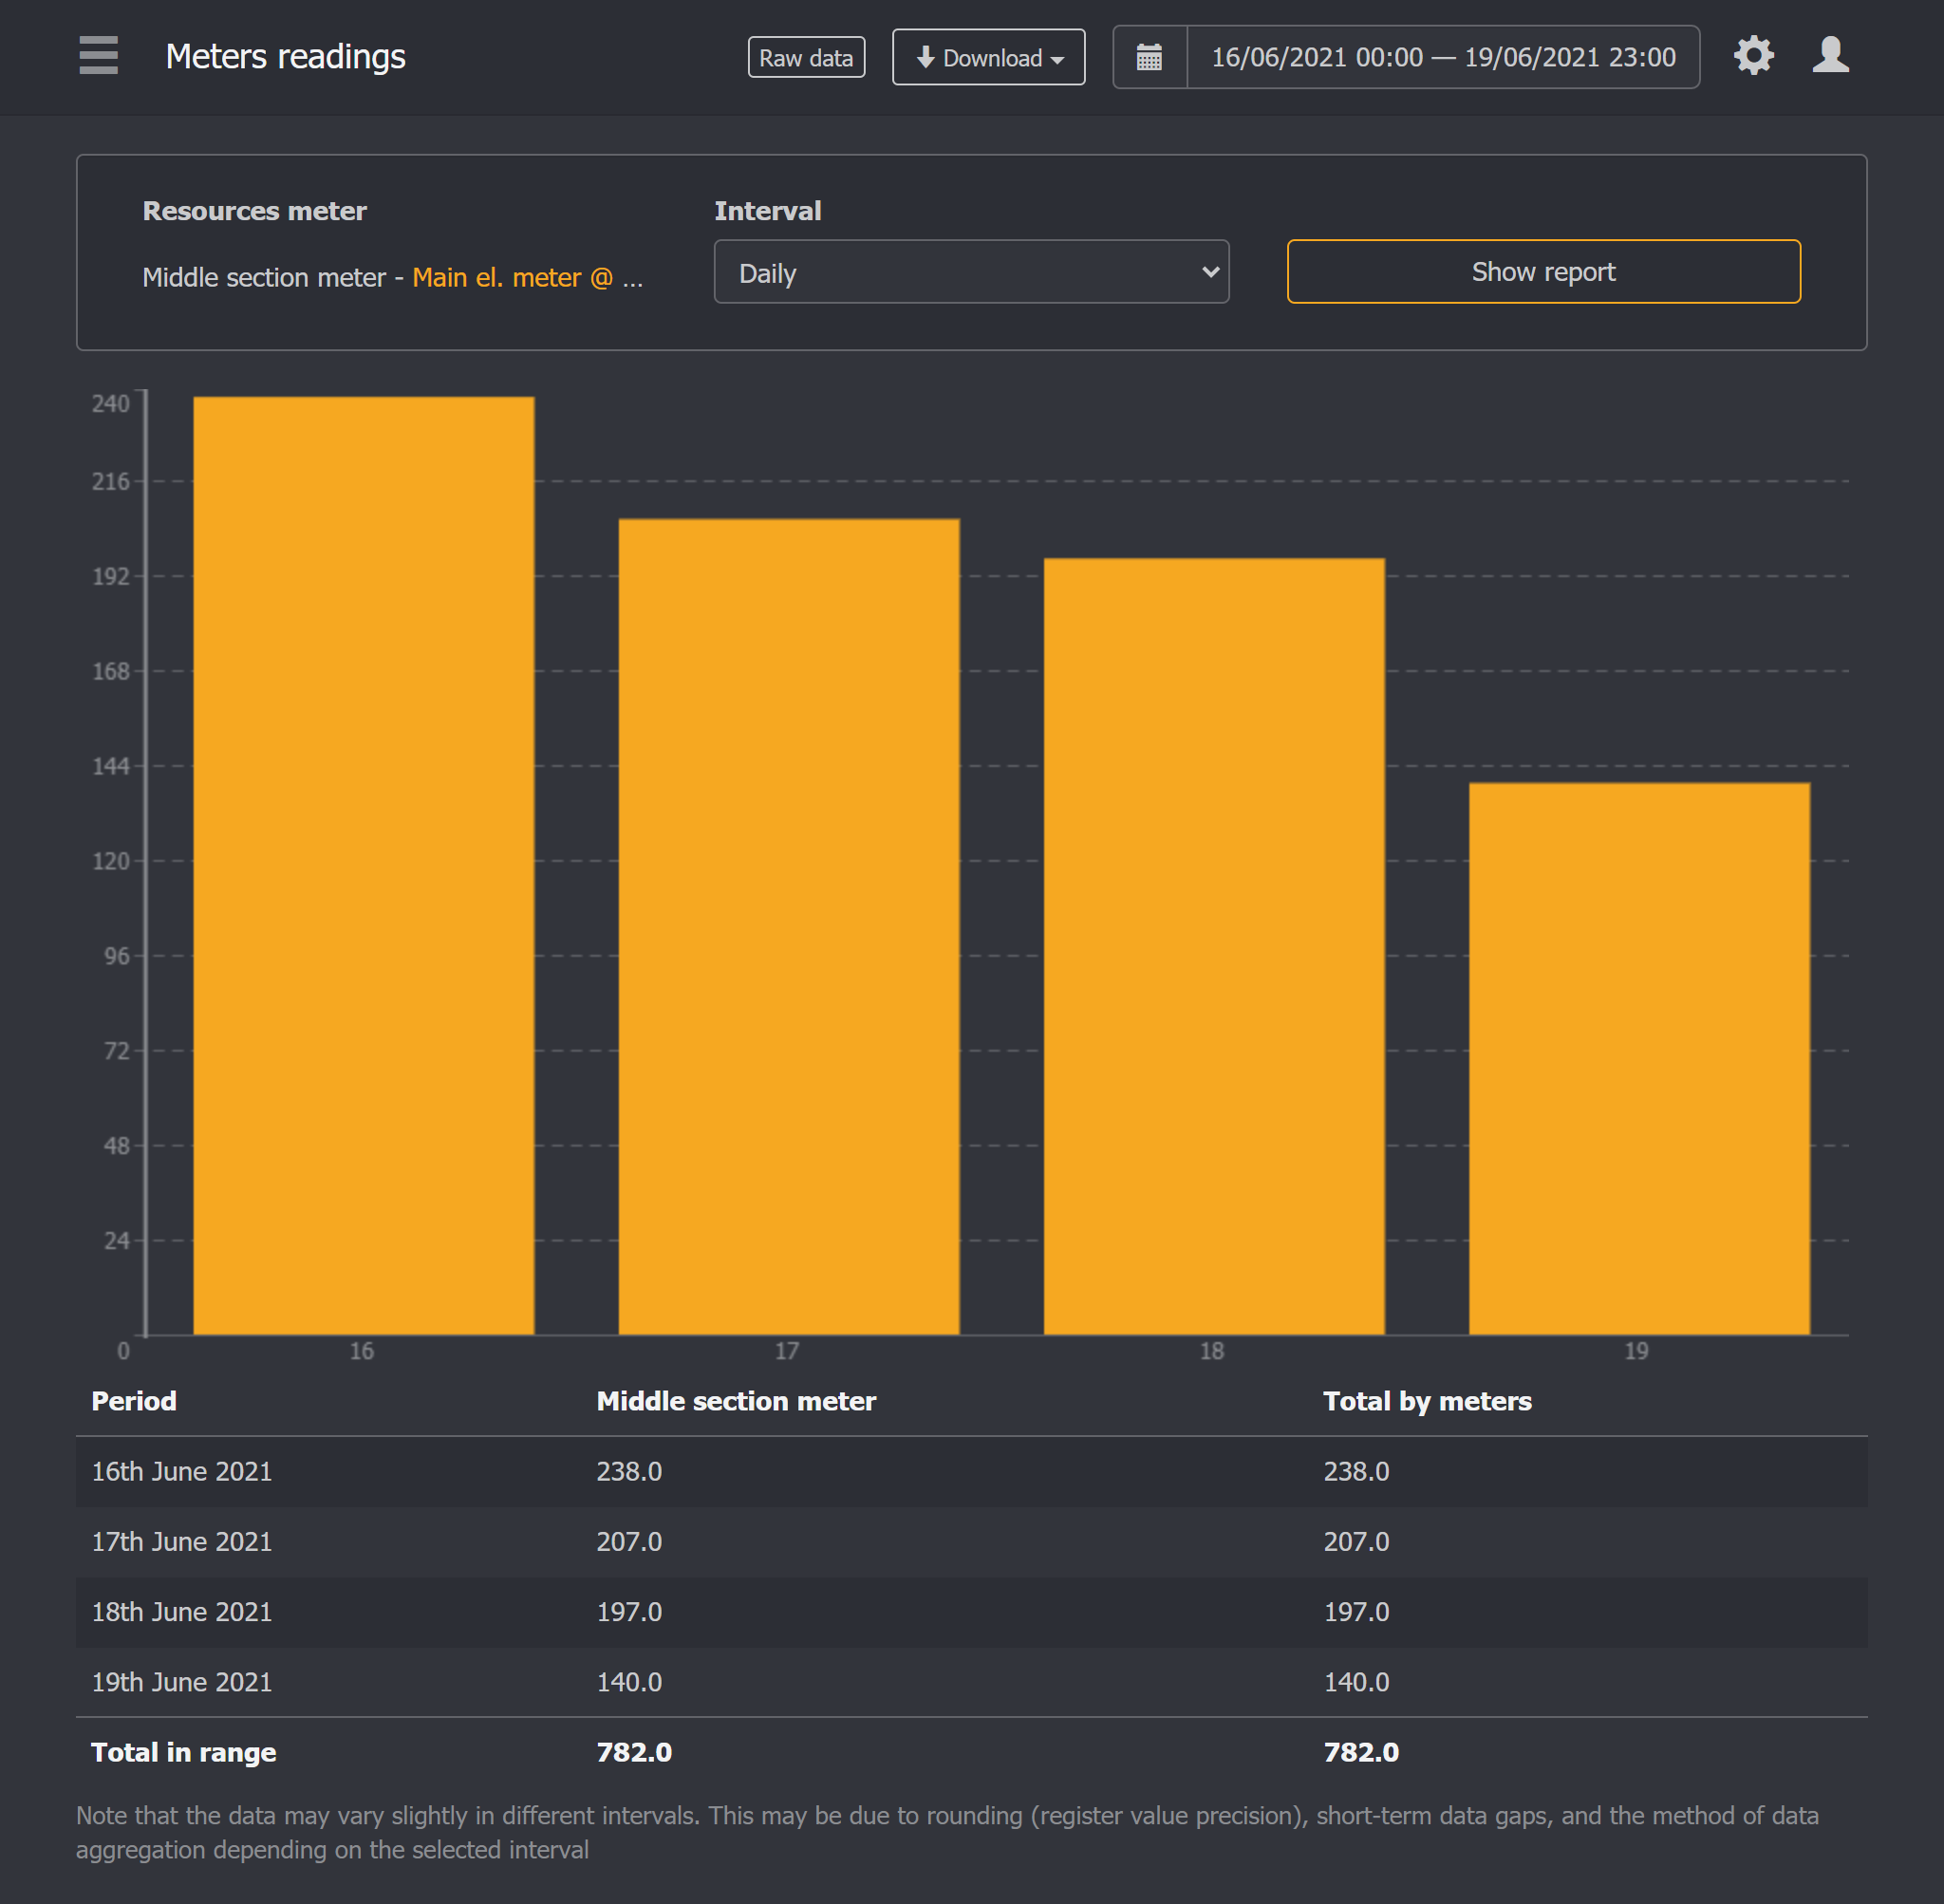
Resource analytics
The new firmware version has built-in tools for visualizing and analyzing readings of arbitrary meters – both resources such as water, heat, electricity, and other meters such as products manufactured, downtime or work time – in the form of various tables, graphs and diagrams that allow you to quickly analyze and correlate the values of their consumption for certain periods or among themselves.
Also, earlier, for the analysis of resource consumption, it was possible to use only standard categories – water, gas, heat, electricity. Now you can define your own categories, for example, the name of the product. It is enough to specify it as a counter of a certain category in the properties of the register, and the system itself will begin to calculate the hourly costs and write them to the database with the ability to automatically generate reports or export to other systems.
The starting page shows a summary (current readings, this and previous month, last 30 days)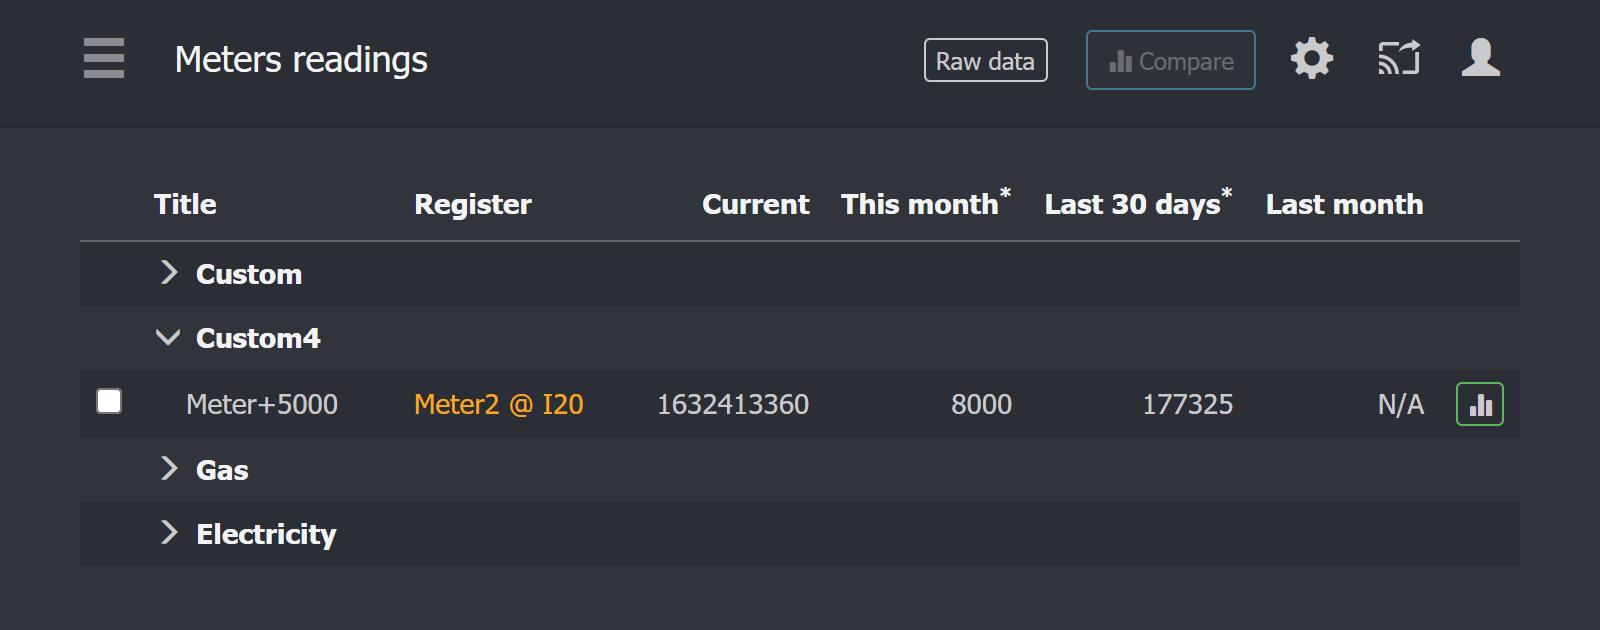
For any counter there are hourly, daily and monthly reports
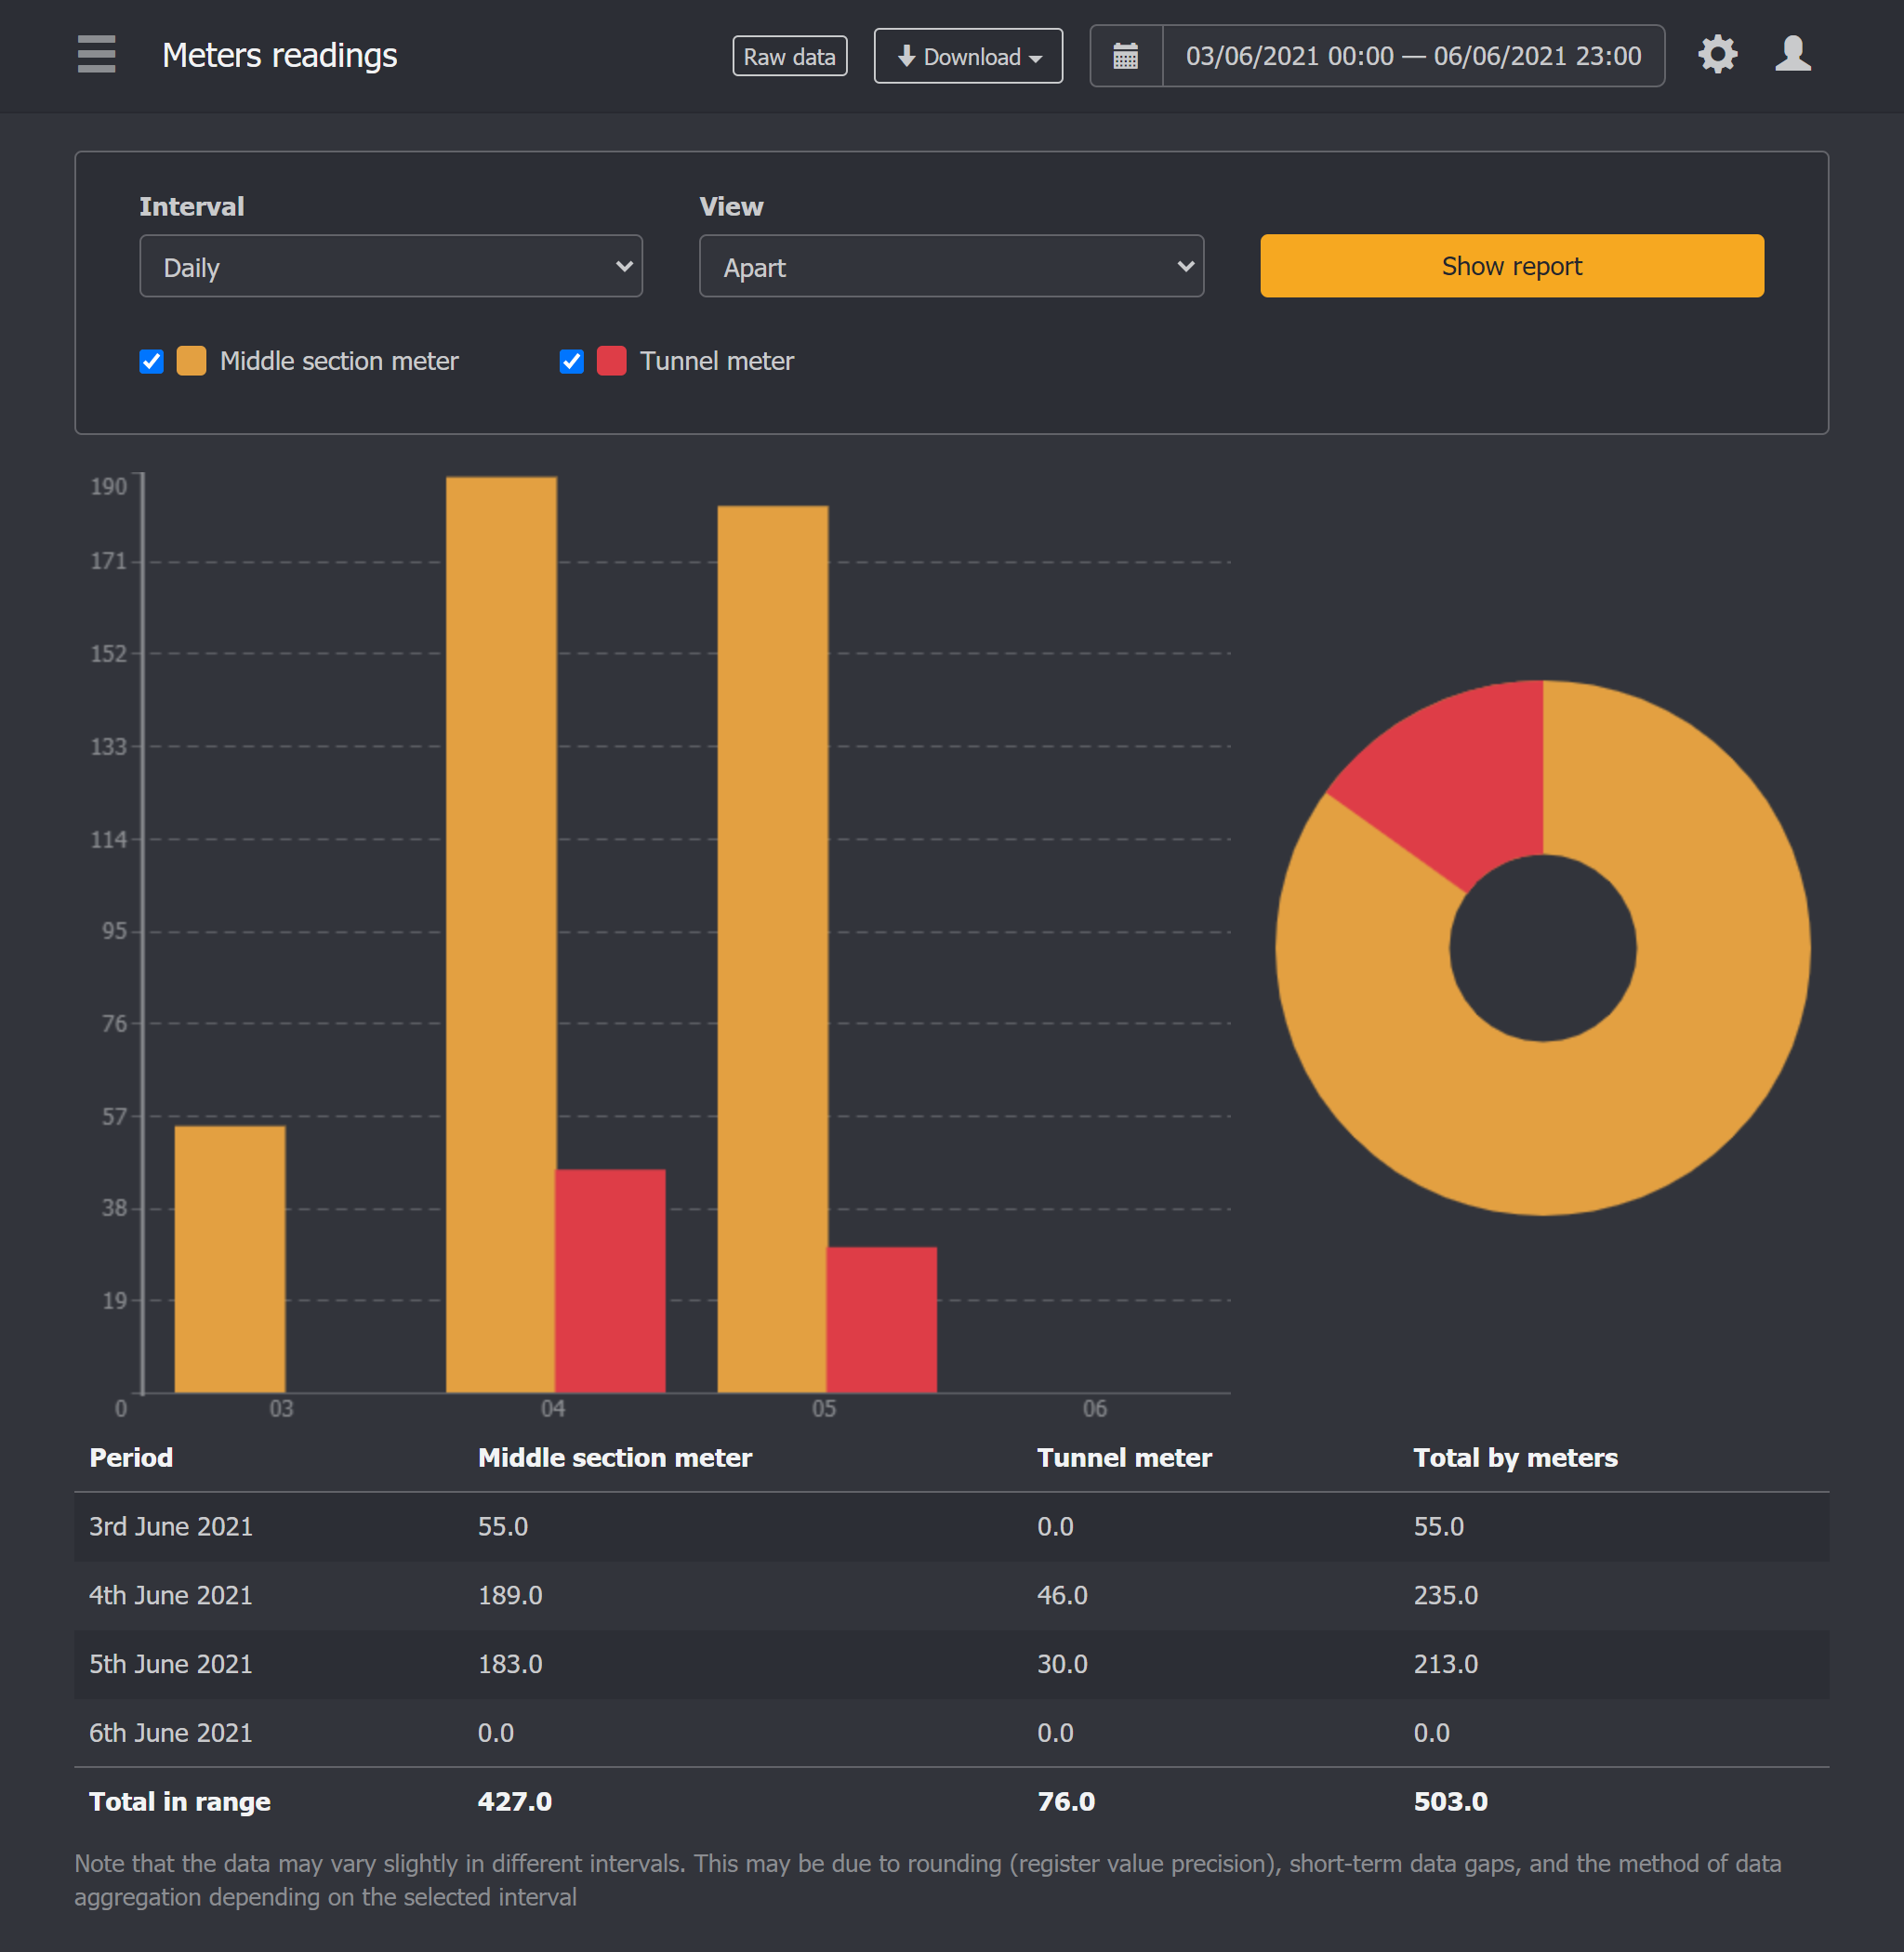
Multiple compare is also possible:
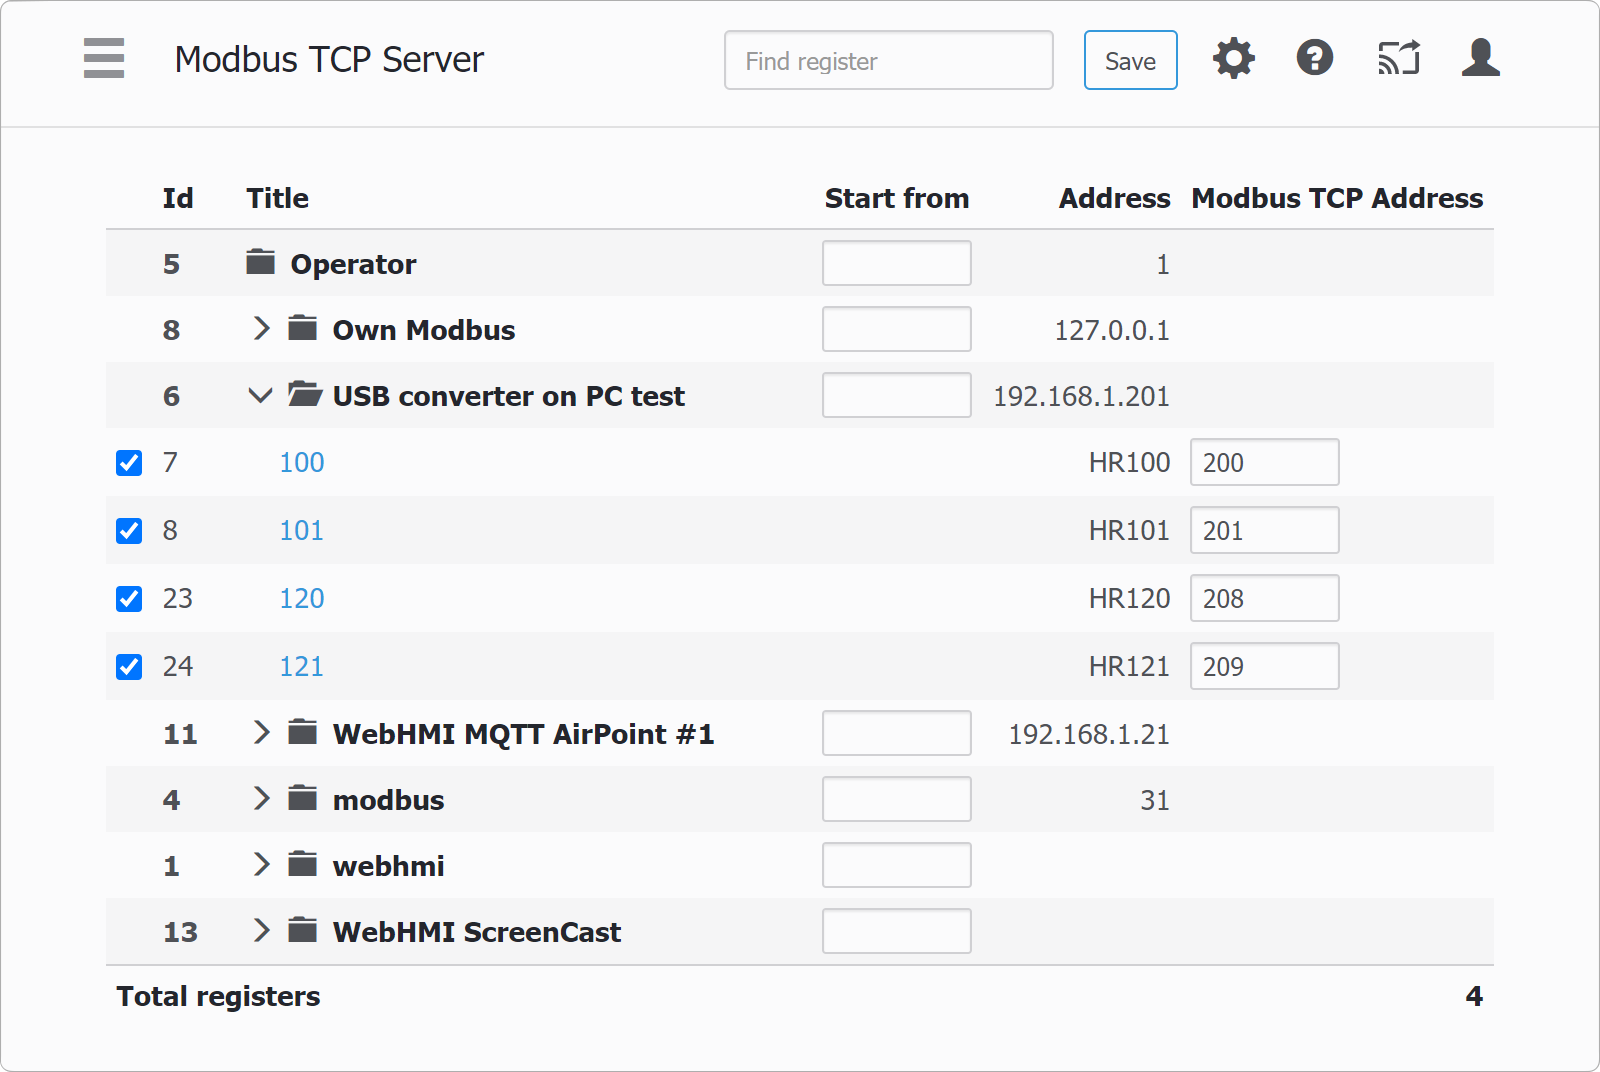
New Modbus TCP server configuration page
The Modbus TCP server, as an inter-system integration tool, has been available in WebHMI since the very first firmware versions. The new Modbus TCP configuration page will certainly please you. Now its structure resembles a project registers tree with straightforward navigation and assigning addresses (with auto boundaries check), which is especially valuable for big register lists.
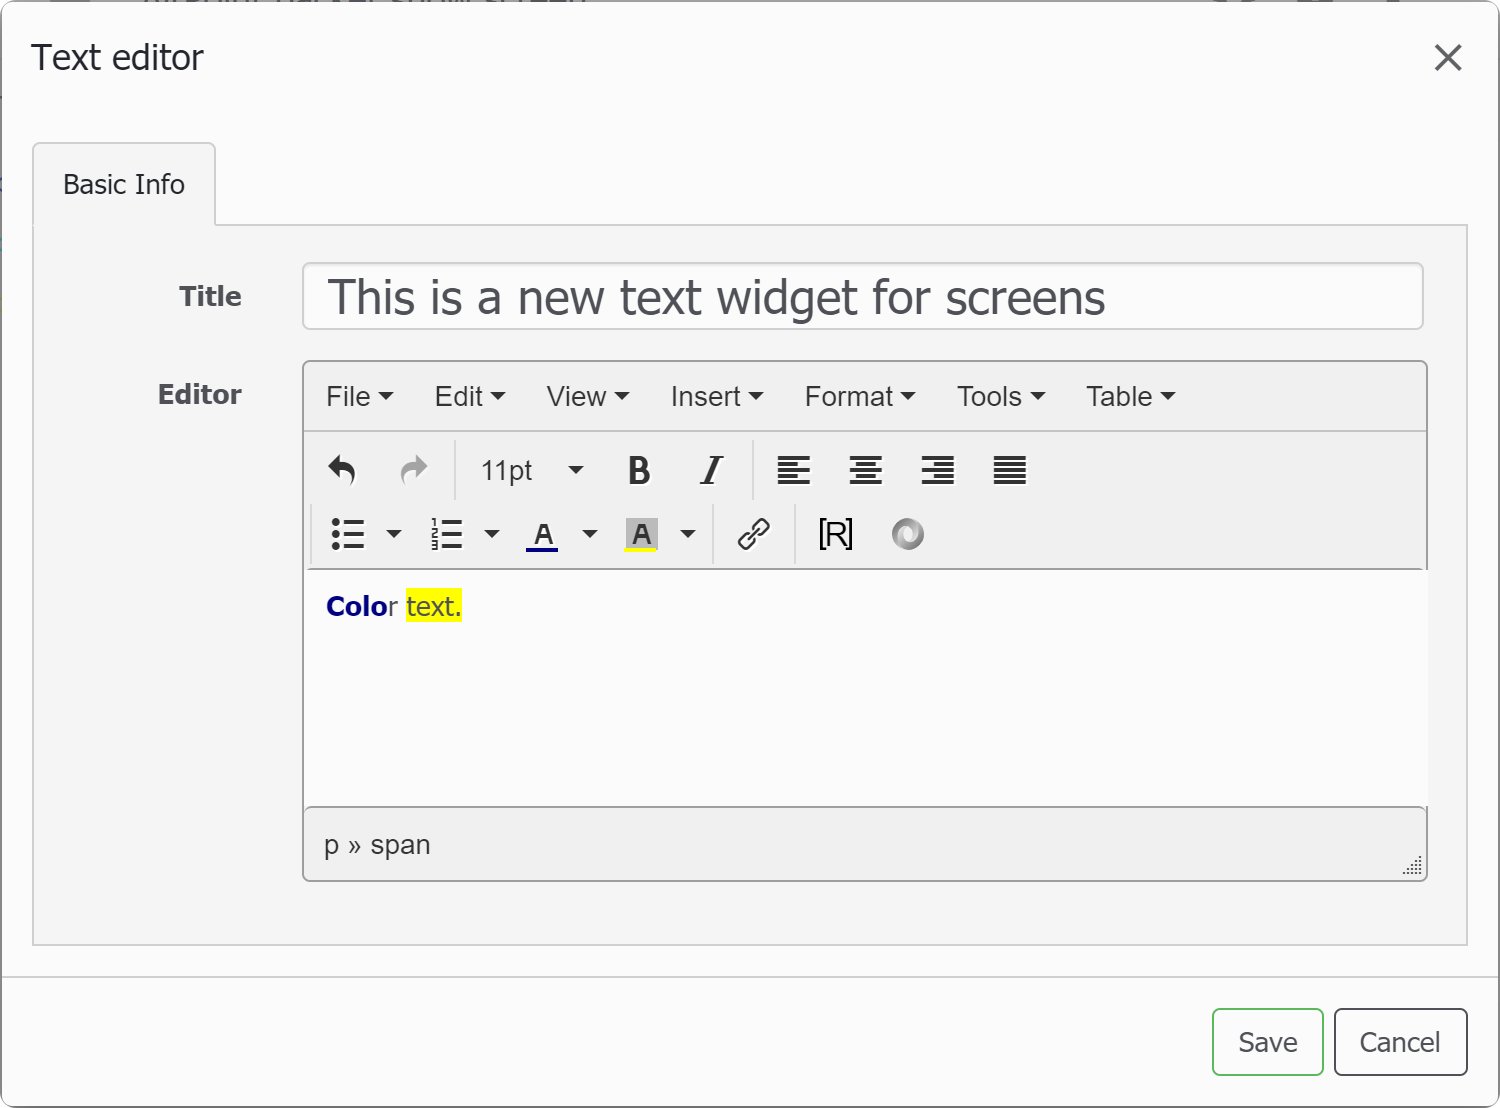
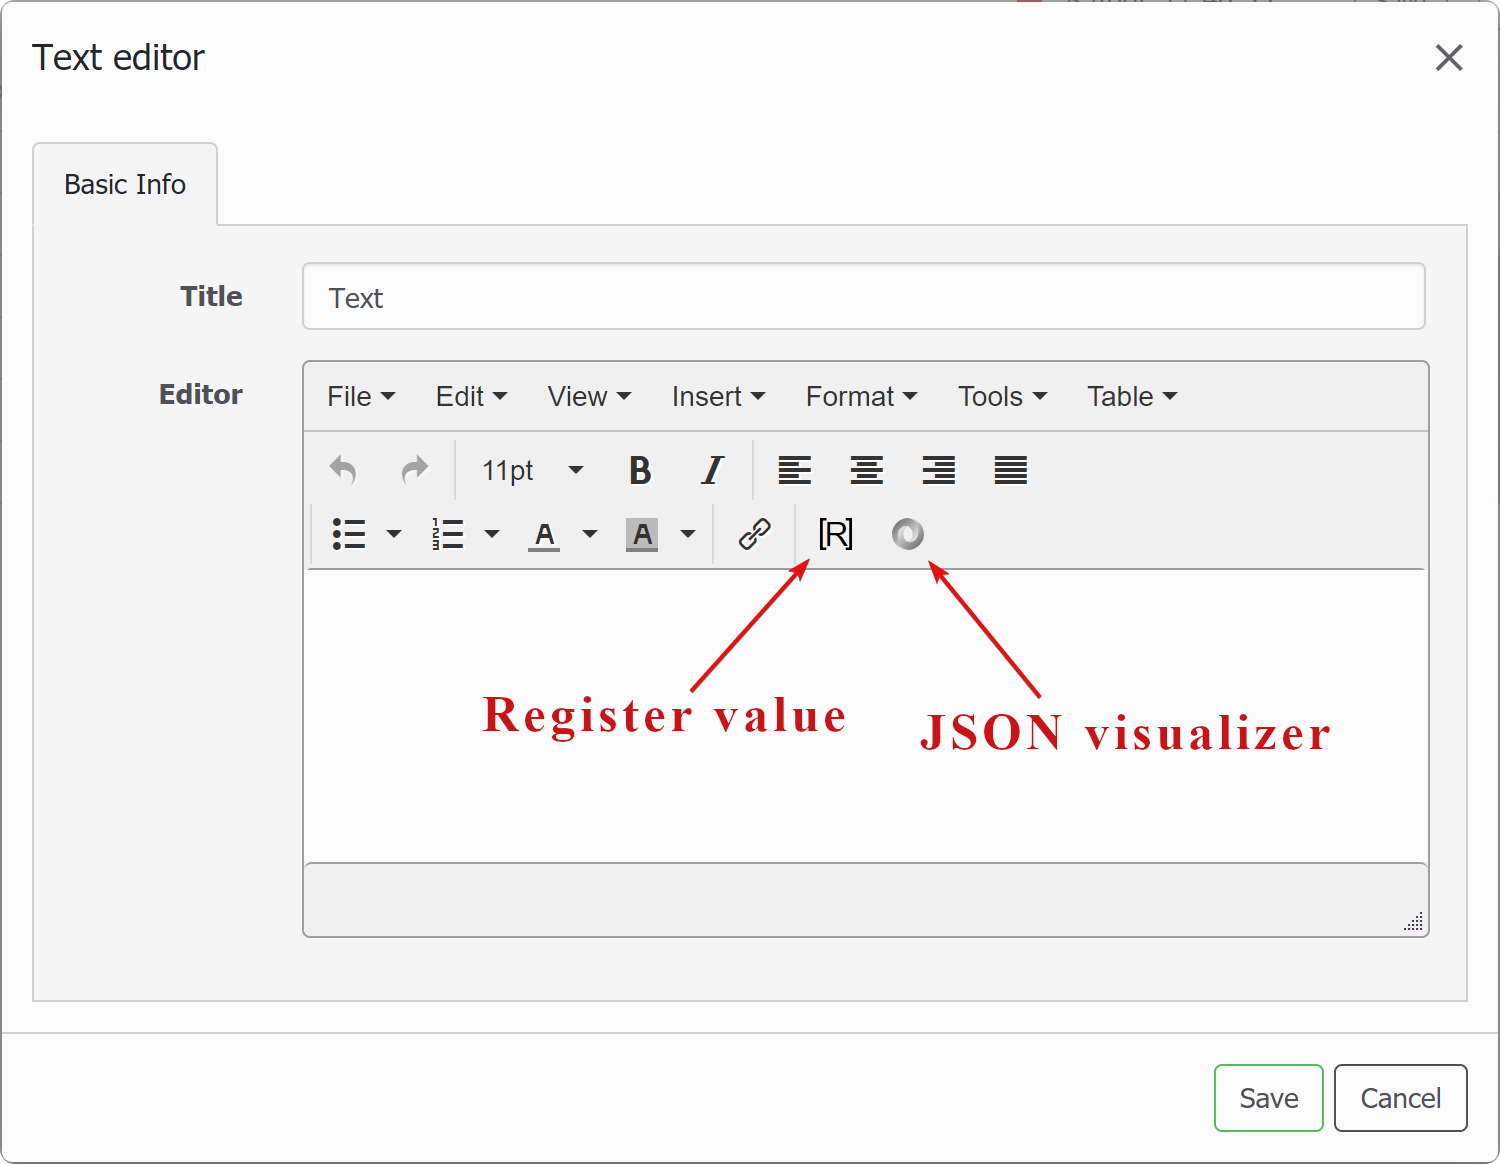
New screen widget – HTML editor
Tables are one of the common and practical means to represent data. Despite its plainness if one started to implement them, quite a number or complexities would arised. So far, imitating a table in WebHMI has been a troublesome thing. Now we’ve added a functional WYSIWYG HTML editor for easy table drawing or arbitrary text formatting.
By default, the “from factory” firmware has a light version of the editor, and the full version will be installed via DLC mechanism.
Visualizing JSON data
There are many applications where a big set of user’s parameter has to be processed, e.g. settings for a complex machine, lists or schedules in the form of tables. In the usual approach, a whole set of registers had to be used to organize the table, which could be very cumbersome both in implementation (thousands of registers may be required) and in processing (increasing the load on the system).
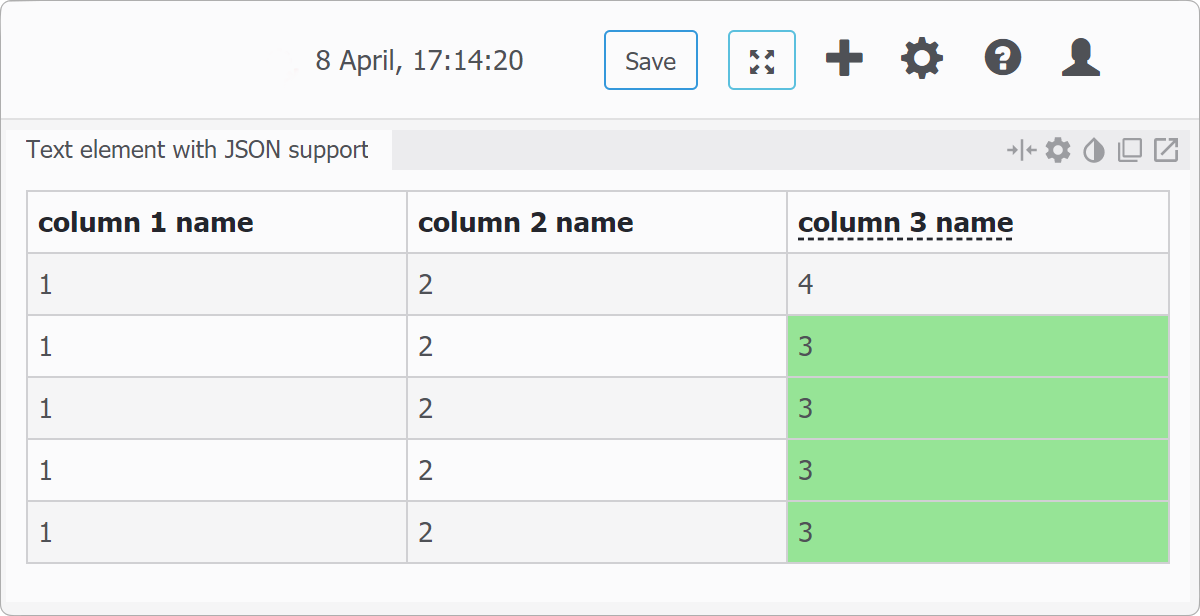
To store such tables and structures, it is convenient to use JSON – a widely used format for transferring and storing small data structures. It is also supported by Lua scripting functions on WebHMI, and thus only one string variable can be used to work with such structures. For convenient user work with data in this format, there is a special component built into the widget with an HTML editor. It allows you to display data stored in JSON format as a scrolling table, for this you just need to specify in which variable it is stored. You can also edit them here. In addition, conditional formatting of table cells is also provided to improve readability, highlighting data in rows or cells that meet certain criteria.
Links to the help site
We are trying our best to make the user interface for the WebHMI fully intuitive, and we think we’re not bad at it. Probably because of this, some customers make their projects without even knowing about the documentation site docs.webhmi.com.ua. For your convenience we’ve added context backlinks to the help site right into the interface which will lead you to a respective topic (an internet connection is required).

Better work with registers and connections
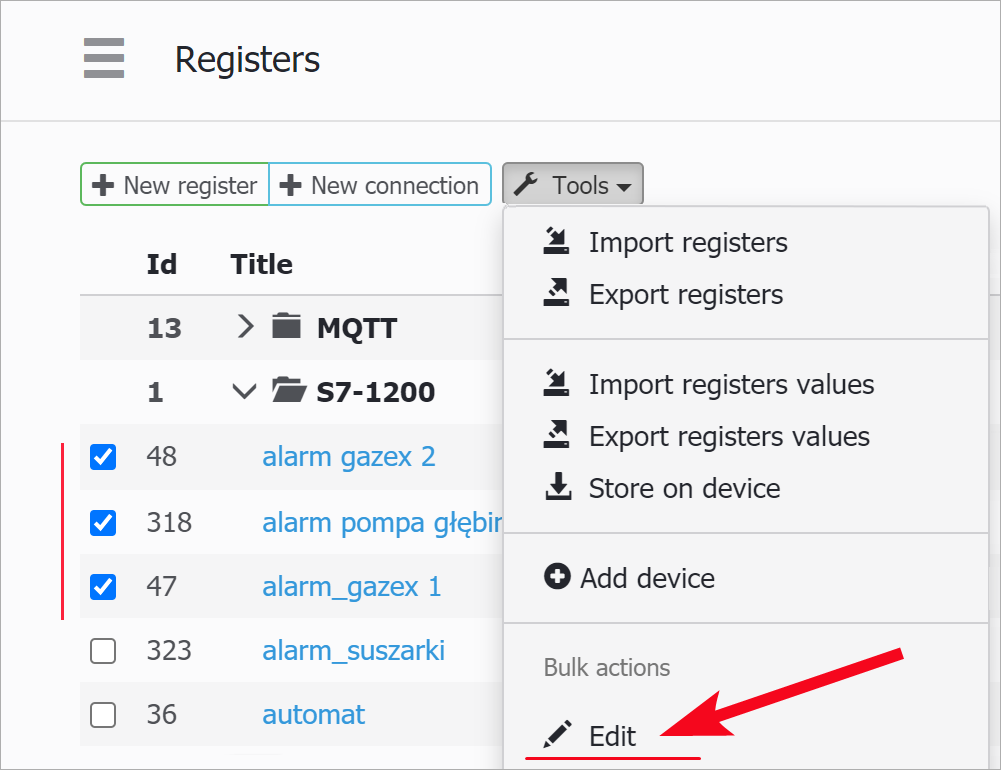
Group register properties editing
Actually, as the name implies, this function allows you to quickly and conveniently change the properties of the same type (such as: the polling period, units of measurement, states, etc.) immediately at a group of registers, which greatly speeds up the work with them. Previously, this was possible only through the export of registers to a csv file, editing it and importing it back into the project, but now it can be done immediately through the interface. More information can be found here..
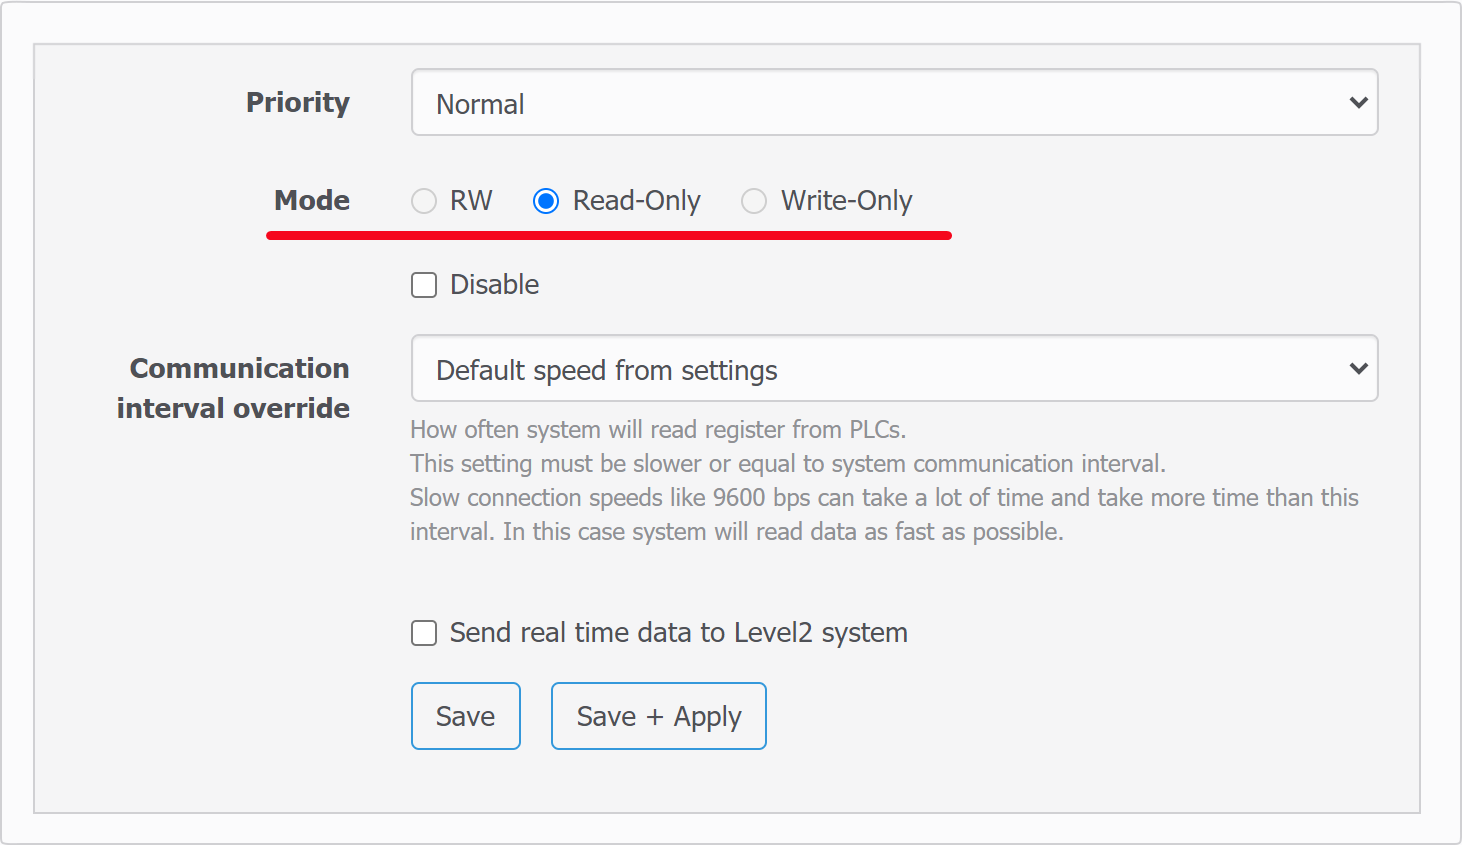
RW mode for registers
There is now a convenient function for assigning register access mode – “read / write”, “read-only”, “write-only”. There are devices for some registers of which only writing is possible, for example, the control word of some frequency converters, refrigeration controllers, etc. For these devices a custom protocol.
Read-only mode is also useful for distributed systems with shared data. For example, this situation can arise when using the MQTT protocol, when the user can inadvertently override the data of another device.
Adding devices via Device manager
With this new function you can add ready device profiles from the library in one click. At the moment there are few – 7bit Synapse, Modbus Proxy & Mediator gateways as well as AirGate AirPoint wireless remote data acquisition modules, but the list is going to grow.
Topic search when adding the MQTT devices
A new topic search function has been added, for easy adding MQTT topics to the register tree. You just click on the search icon in the connection title and the system will start forming a list of changed topics in the broker. The only thing left then is to mark necessary ones and save them to the register table.
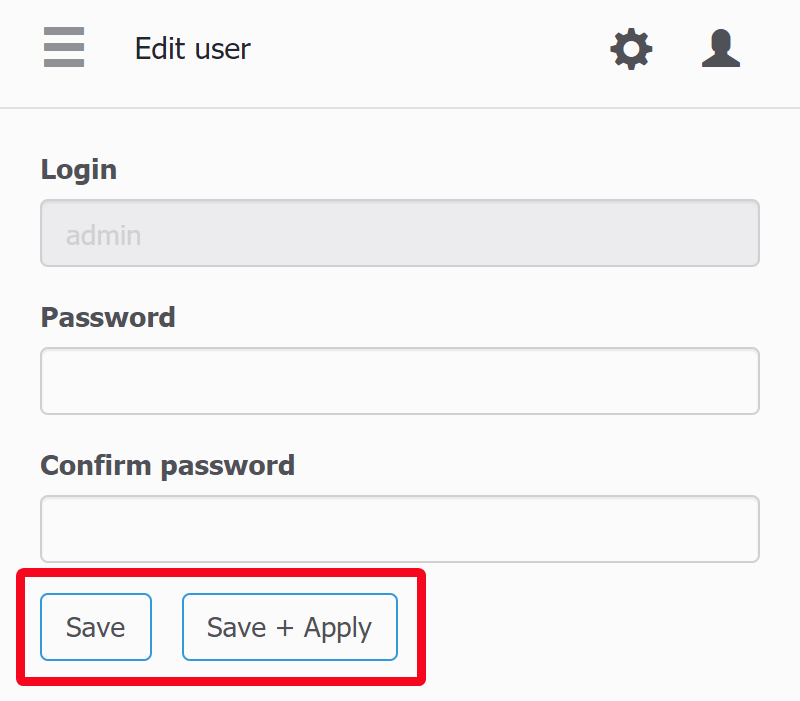
Save and Apply
When editing a project, it is often necessary to make several edits in different places in the project. Before, each small change was accompanied by re-initialization of the system, which in turn caused a heavy load on the processor in large projects. Now, there is a tool that allows you to make many edits and then apply them in one go, which ultimately speeds up the time to complete these operations.
Security improvement
The Polish Center for IT Services and Cyber Security CERT.PL at the NASK Institute (Research and Education in Computer Networks) has tested WebHMI’s potential security issues. The vulnerabilities found have been removed.

New components
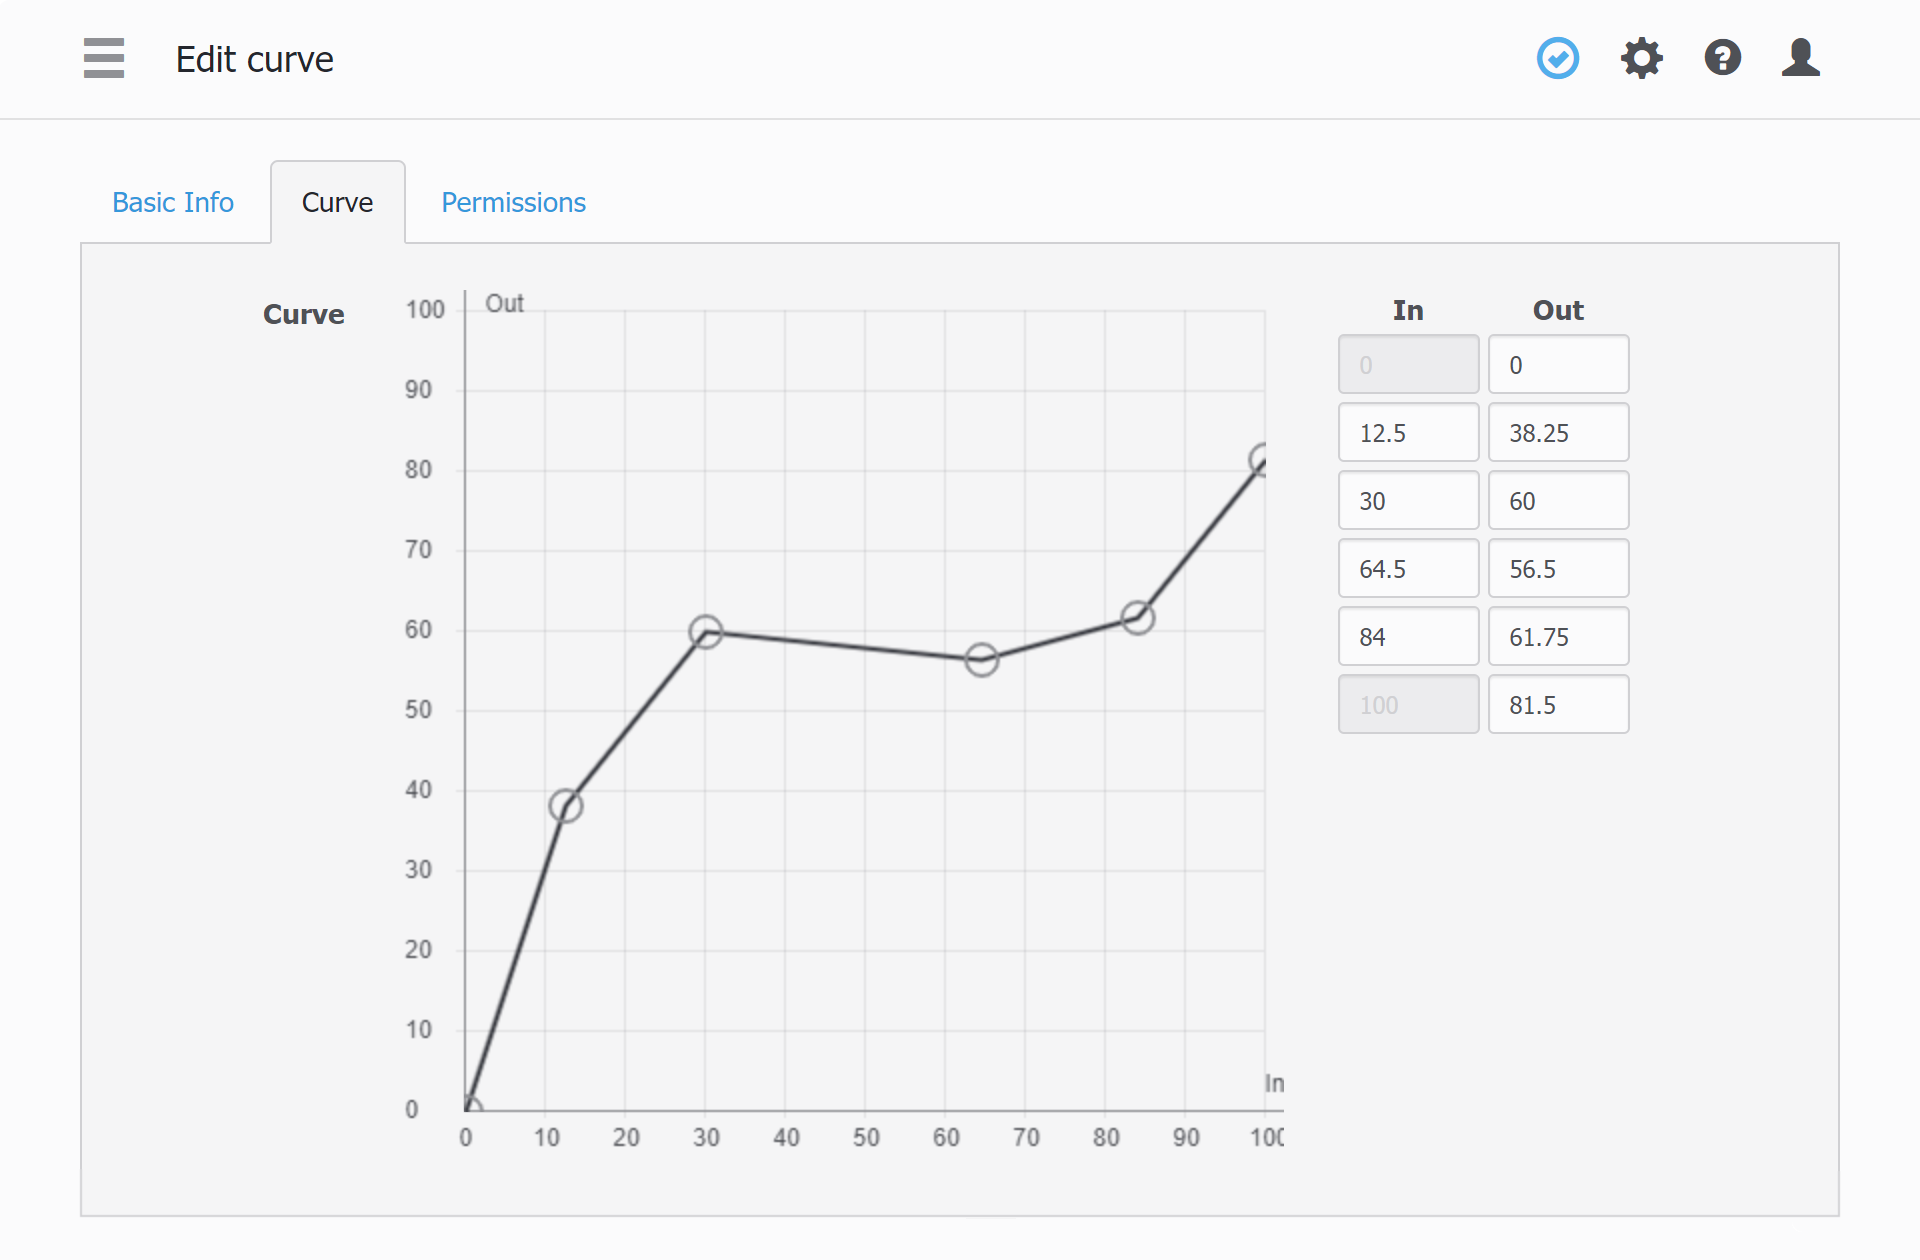
Curve component
With curves it is possible to describe a transfer function “input – output” for the system controlled flexibly and clearly, continuously in the whole range of values . Their popular use is setting up daytime schedules for the parameters like temperature or pressure, but there can be much more – you can set any dependencies of x(y). E.g. you set temperature setpoint along a multi zone furnace etc. The curves are managed in a special menu and then are available for scripts and dashboards. Read more on the docs page.
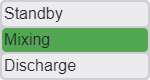
Mode indicator
A typical task when visualizing multi-step or multi-mode production processes is showing their actual state with the dictionary, like “Standby”, “Mixing”, “Discharge” etc. The mode indicator is a handy tool, showing all possible states of an object and highlights the current state, that shows clearly what will be the next, what was before, we are starting or finishing. The component is linked with the register, which in turn is linked with the dictionary, and then you just write to the register a number, reflecting the process state.
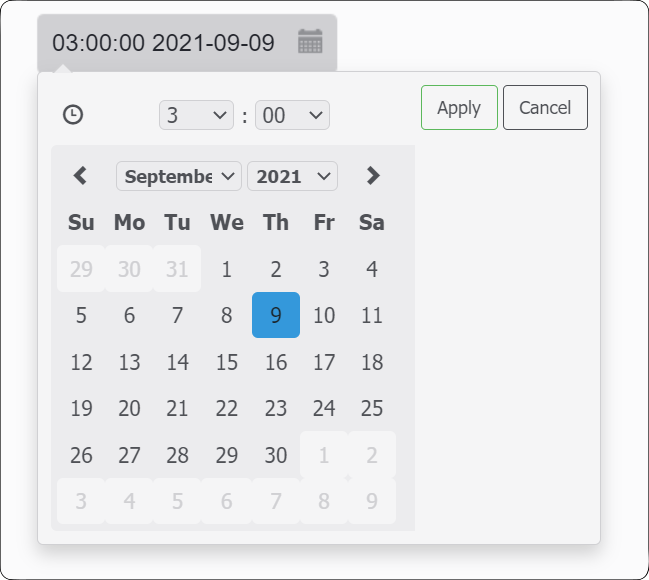
Date picker
The date picker for dashboards – is a common user interface calendar date picker element, which accepts user input and stores it as a single unix time number in an internal register. Using embedded lua functions you can get required day, week day, hour, mituen etc. and use them in the control logic. Before a whole dashboard with many fields would have been required for this.
Increase/decrease value in the edit value control
Edit box has got new features – now you can increment/decrement value with software buttons. This mode is more convenient on mobile devices, not involving a keyboard for entering a value.
![]()
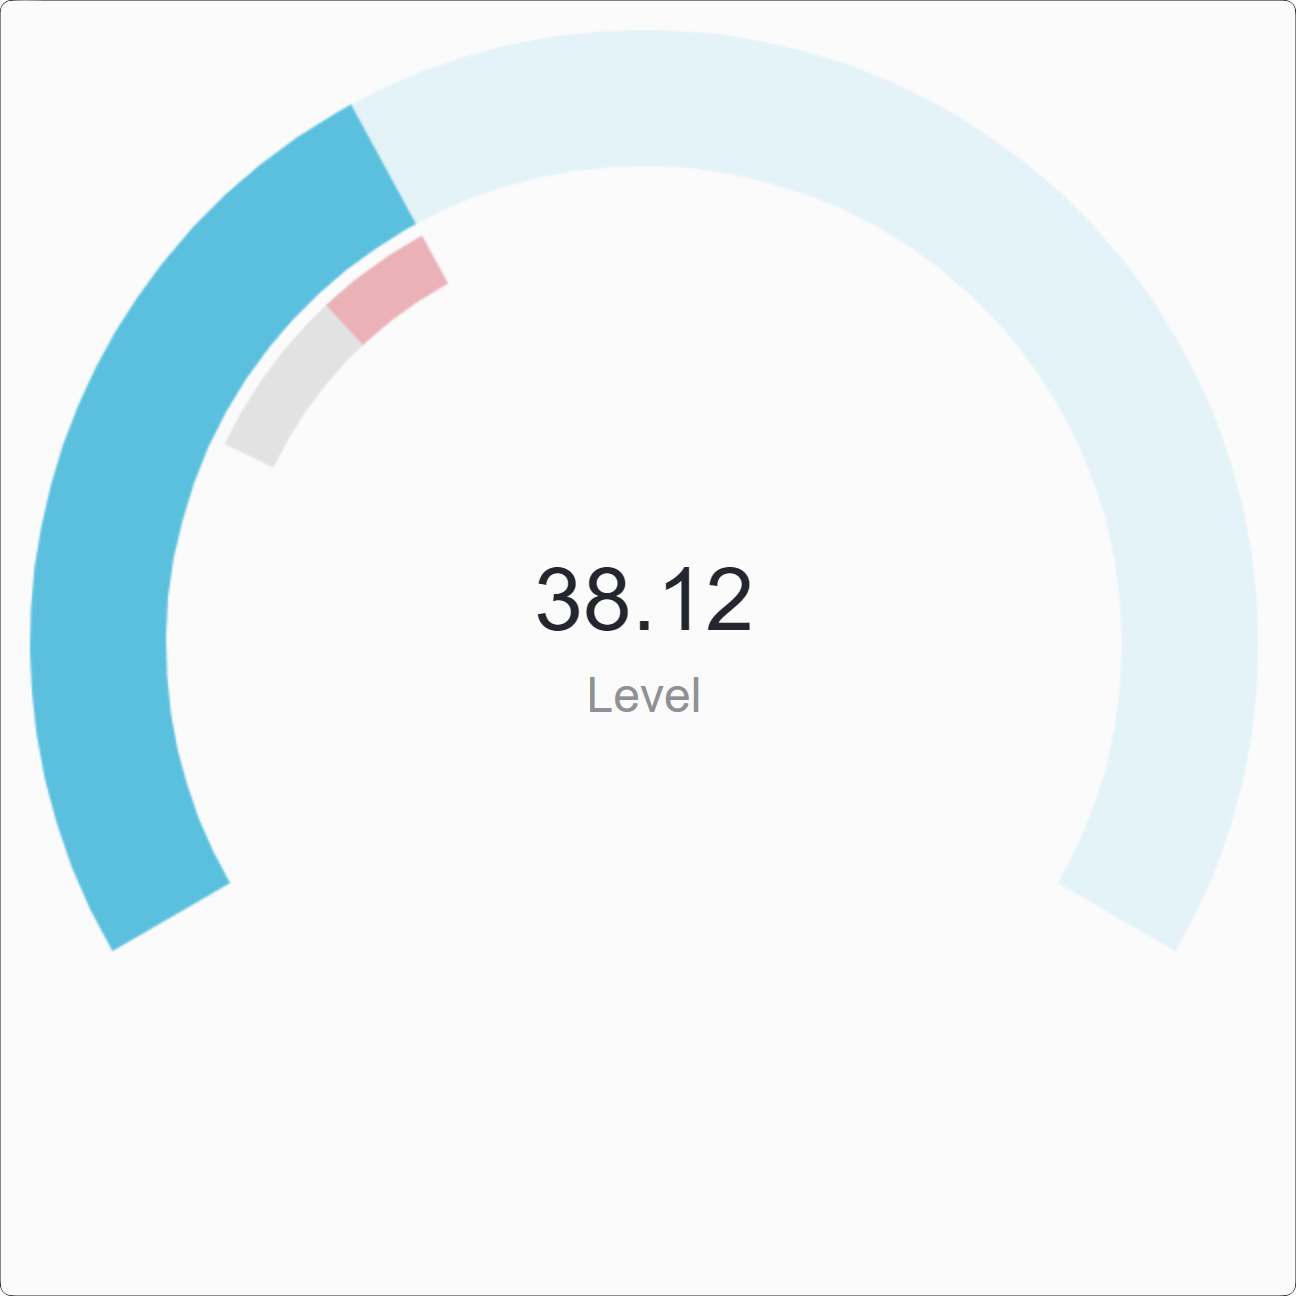
Trend indicator in the value widget
The current value widget for screens now can show rising or falling tendency of the value shown referenced to an average value for the period. In the widget settings respective parameters have been added: averaging period and colors for the rising / falling tendency.
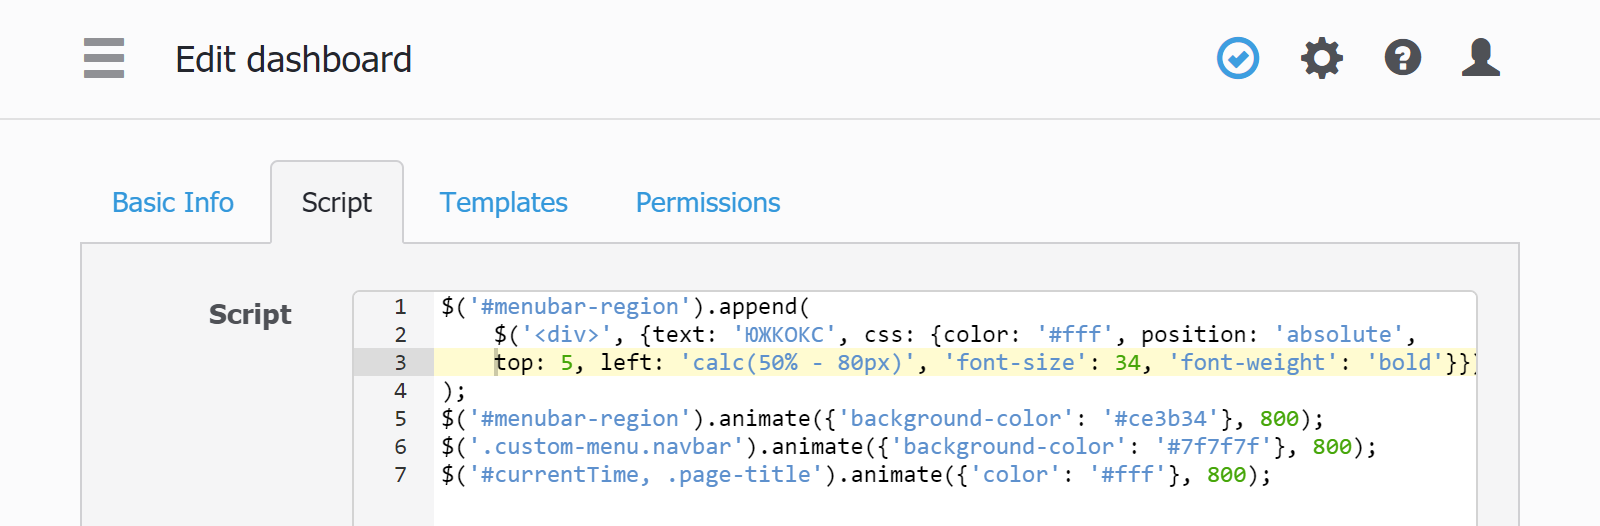
Dashboard JS scripts (for non-standard applications)
Sometimes you may need a custom visualization which is impossible (or very hard to) implement with existing tools, then the JS script for dashboards is an useful option. The following are examples of these tasks:
- The customer was presented a new requirement to change project color scheme after he had almost finished the project. That meant a huge amount of efforts on reworking visual elements in the project. The task was solved with a small JS script, redefining colors in the existing visualisation elements.
- “Smooth” dashboard object animation regardless of the data/screen refresh rate.
- Drawing non-standard charts like X(Y), temperature profiles etc.
- Using presets to load data and change time interval for specific graphs or diagram, depending on user input
Some minor but useful extras
Change history on project restore
Sometimes working on a project you need to roll back, to cancel the latest changes or rework something. There might be perplexities at this moment, because the project backup file name has only the date in its name, but it doesn’t say anything about actual content that you must track somehow using your memory or notes.
A special tool was added, which analyze log file (log*-sqlite3) and tracks project changes with respect to the actual project configuration database.
Guest login
Button for user login without password. We decided to add this feature due to numerous requests from our customers. Sometimes it is necessary to give access to some functions of the system to everyone, without personal binding with a username and password. Now it is possible to activate the built-in guest / guest account which will add the corresponding button on the login page. The text for the button and the access settings can be edited on the user management page.
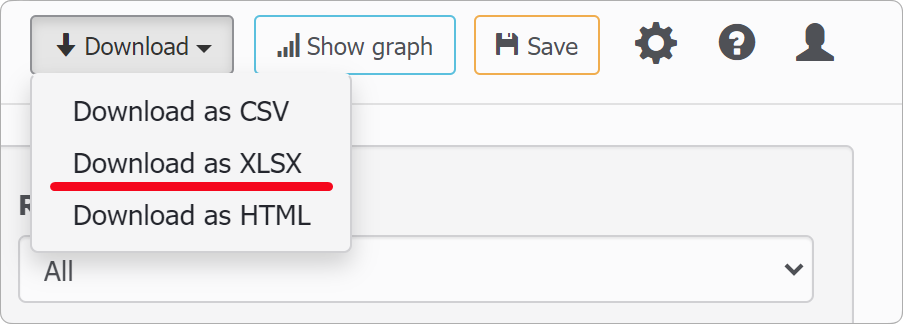
Data export to XLSX
It is a function of direct export of the logged graph or diagram data right to the MS Excel, that’s been highly demanded. It is available after being downloaded via DLC.
DLC (Downloadable content)
The new firmware version has a dynamic update mechanism. If WebHMI is connected to the Internet, then the system from time to time itself checks for updates on the server and updates software components within the current firmware version, which allows for more flexibility in expanding the functionality of the system.
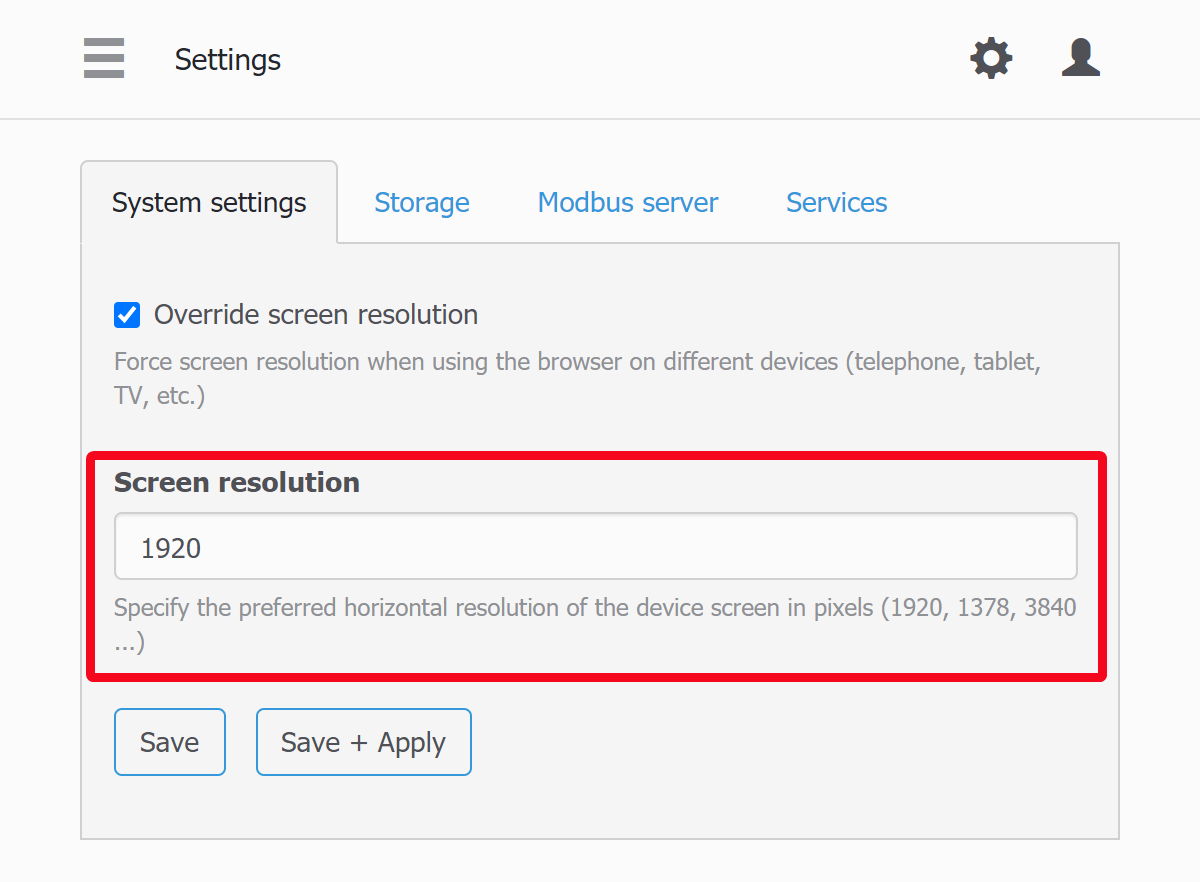
Force screen resolution for mobile devices
Some devices’ OS, like smartTV, may report wrong resolution for the browser, lowering it for a convenient view. In most cases this is not desired behaviour in the monitoring systems, because the visualization is developed for the specific display resolution. Now you can force screen resolution to desired.
Scripts
There are some improvements in the lua editor:
- Global search in all scripts – In large projects, you often need to quickly see – in which scripts and how a particular name is used. The global search field right in the list of scripts has now become an indispensable aid in debugging.
- Console adjustable size – for complex scripts sometimes you might have needed long output to the console which would be cut. Now you can adjust the console vertical size at any moment.
- Lua editor adjustable font size – Choosing right font size makes work more convenient and avoids eye unnecessary stress when working in the Lua editor.
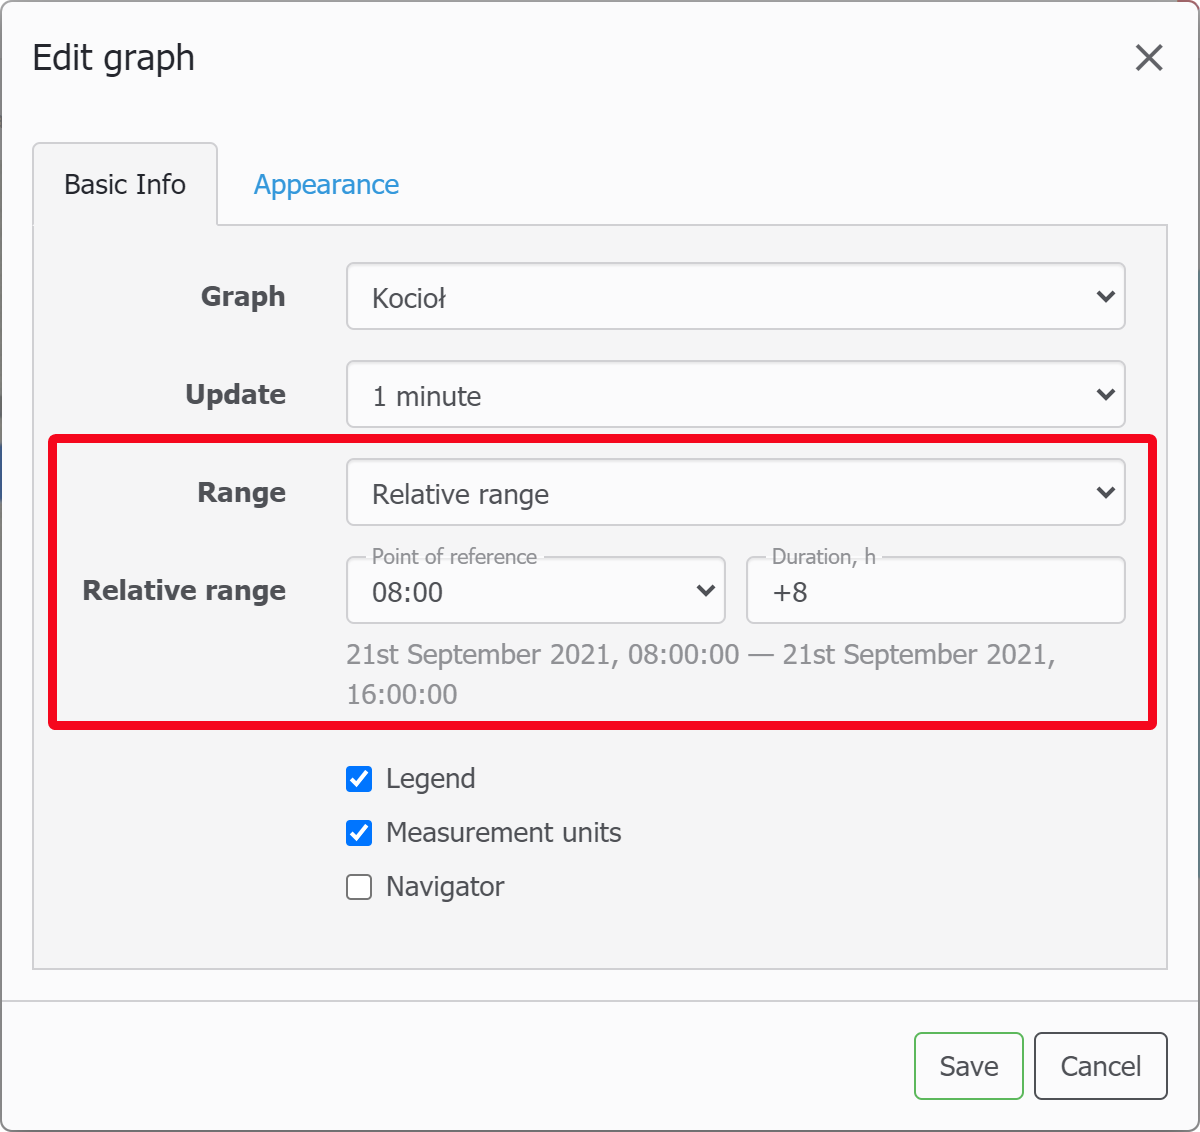
Relative time range in screen widgets
Sometimes you may be interested in a non-standard time interval on the widgets of graphs or Gantt charts, which is absent in the standard calendar, for example, the shift starts at 11 o’clock and you want to watch -8 hours relative to this moment.
System Popup messages
The system informs users about important things, like:
- To change defoult passwords
- Time difference between system and browser
- Exceeding dashboard size limit
- For the virtual box image – about internet disconnection to avoid license exporation before 2 weeks elapses
- other errors and notifications
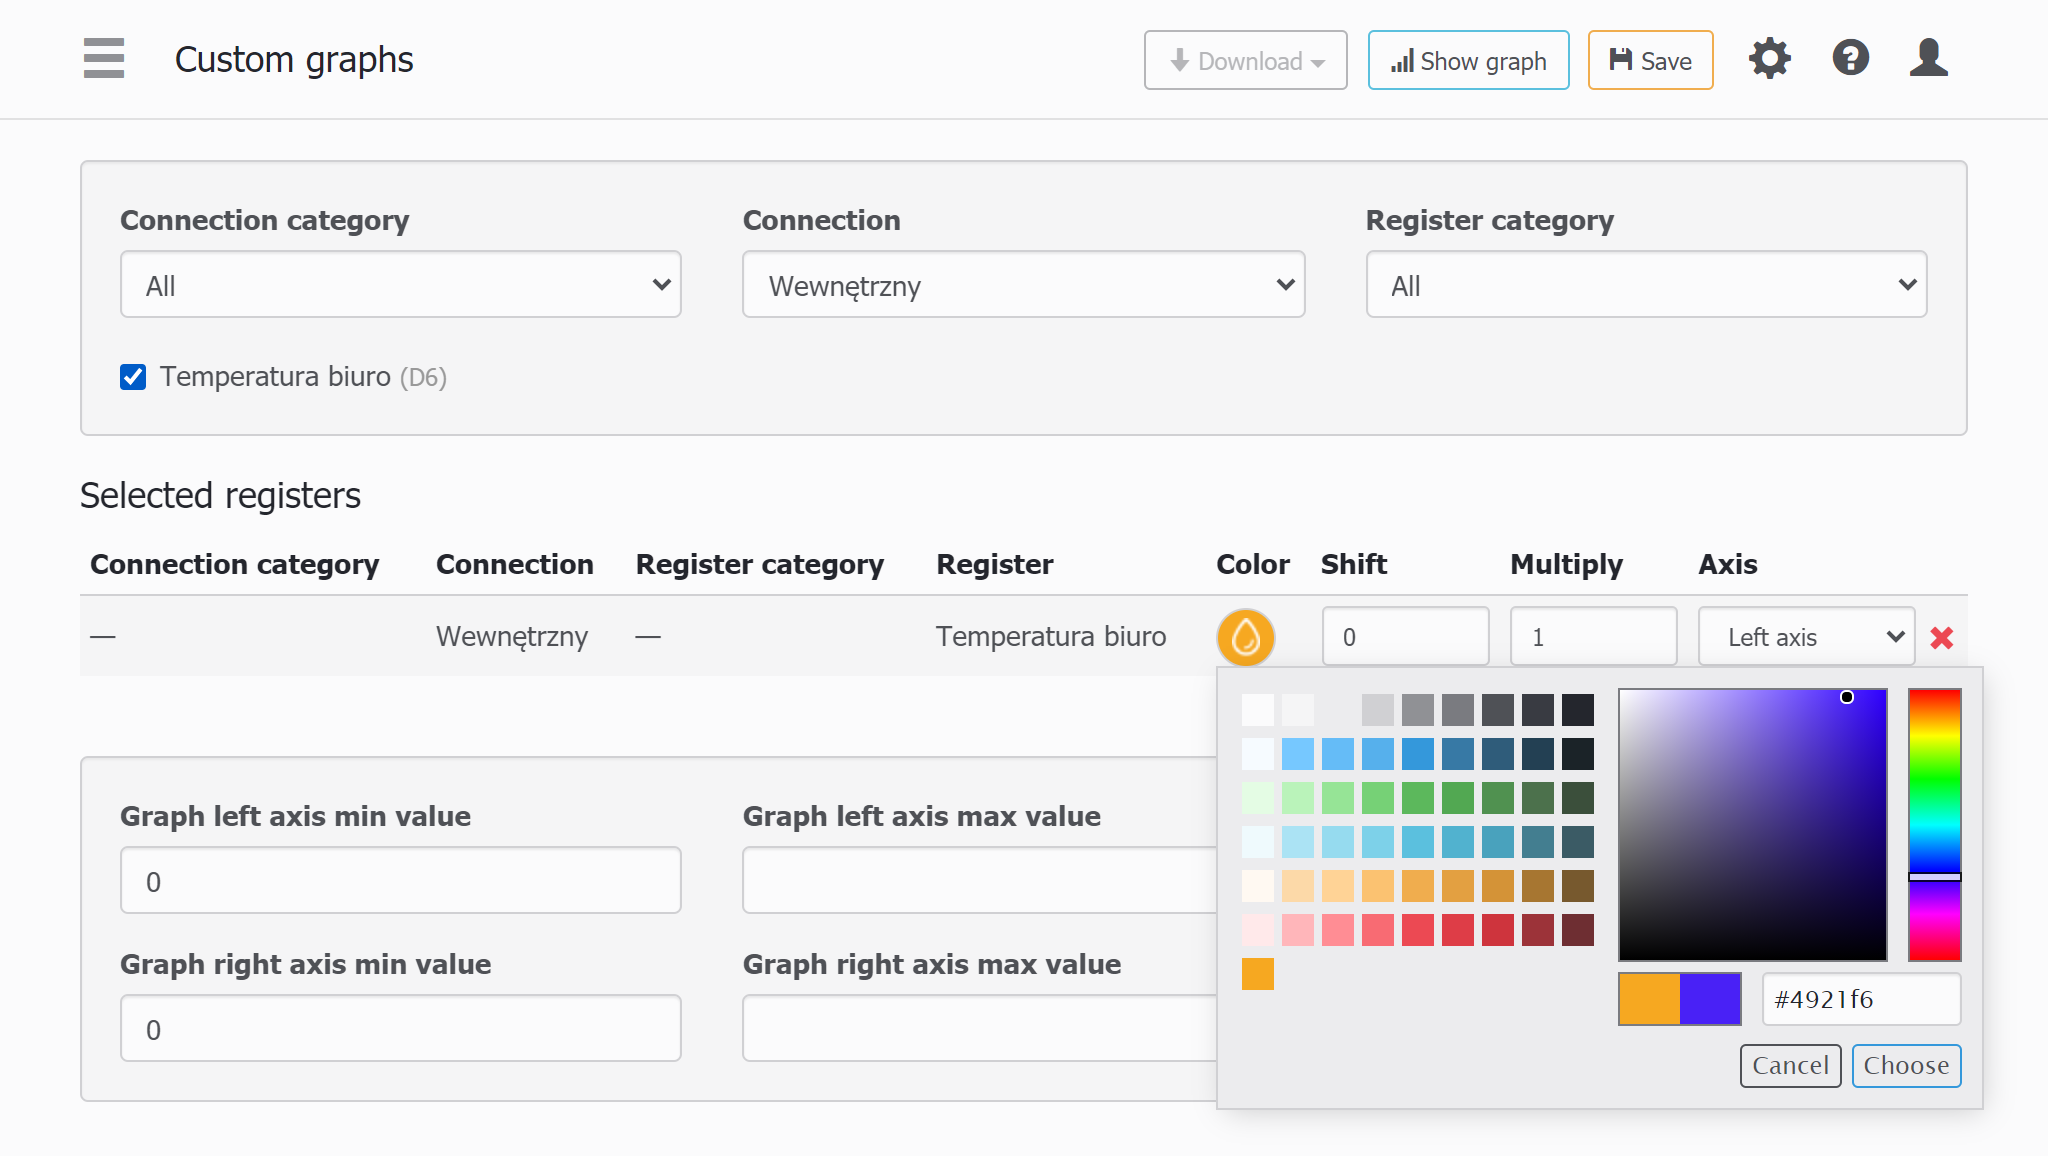
Custom colors in custom graph/trend, custom trend floating values
Custom graphs and charts are a handy analytics tool. Previously, colors for values were inherited from register properties. Now these colors can be set directly during the creation of a graph or chart.
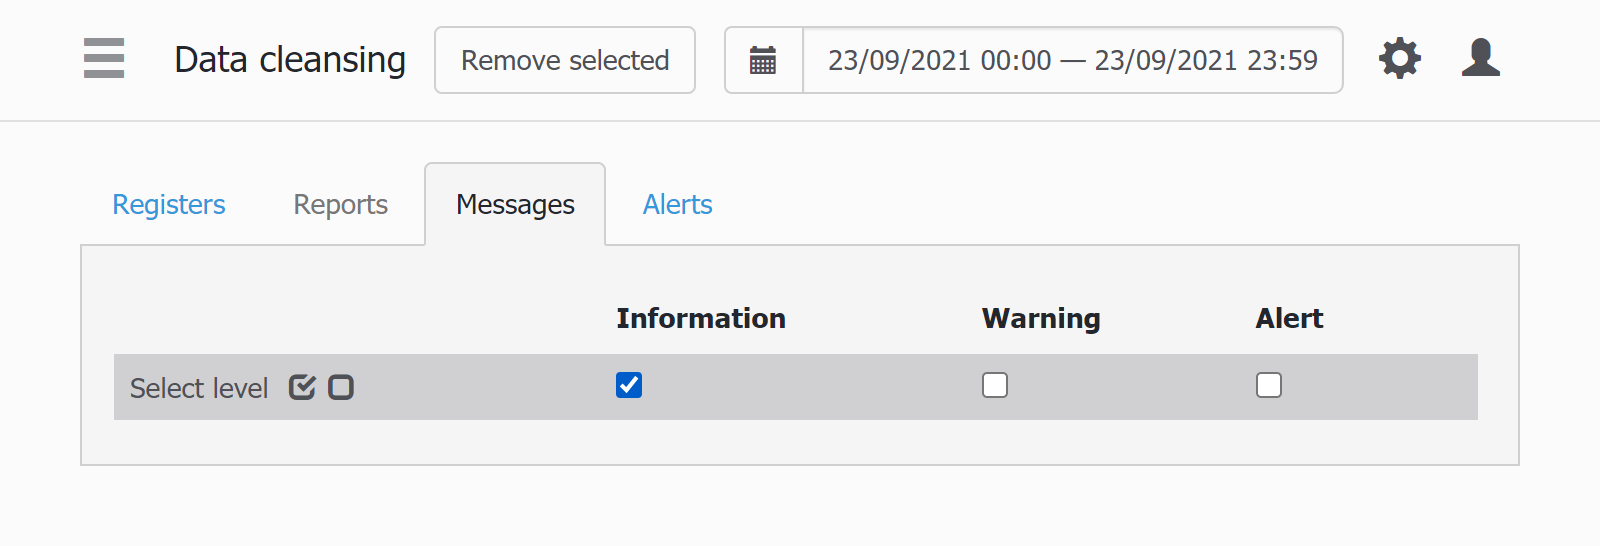
Data cleansing tool
While setting up and adjusting the system, you can configure the recording of a large number of registers in the log, which may then turn out to be unnecessary, but will continue to take up disk space. With the help of the new tool, you can delete only those data that are no longer needed, while leaving important parameters for which it is important to keep the history of changes from the very beginning of the system. Previously, it was only possible to delete all data entirely.
Inline rename for category names
The ability to set categories for objects has existed in WebHMI for a long time and is a convenient tool for structuring a project. As a rule, if you enter the correct name for a category right away, it remains unchanged. However, it turned out that renaming categories is not a very simple matter, especially when you need to do a lot of renaming – for this you had to create another category and transfer the necessary objects to it. (in this case, the project was also reinitialized). Now this can be done by simply clicking on the edit icon in the category name.
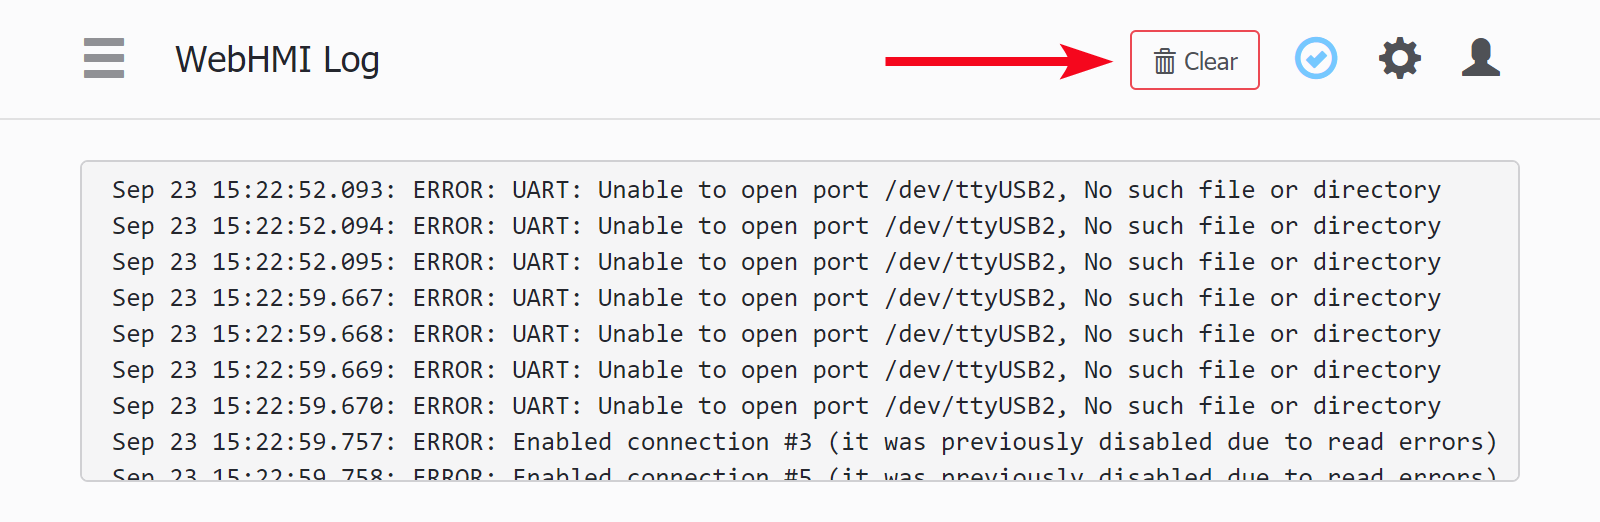
Clear comm log from page
The amount of data in the communication log can sometimes become large, for example, when there are errors or when the trace mode is enabled. When searching for the required data block in it, sometimes it is necessary to clean the communication log, since it is constantly being overwritten (due to the size limitation). Now you can clear the communication log directly from its page, and not return to a separate menu.
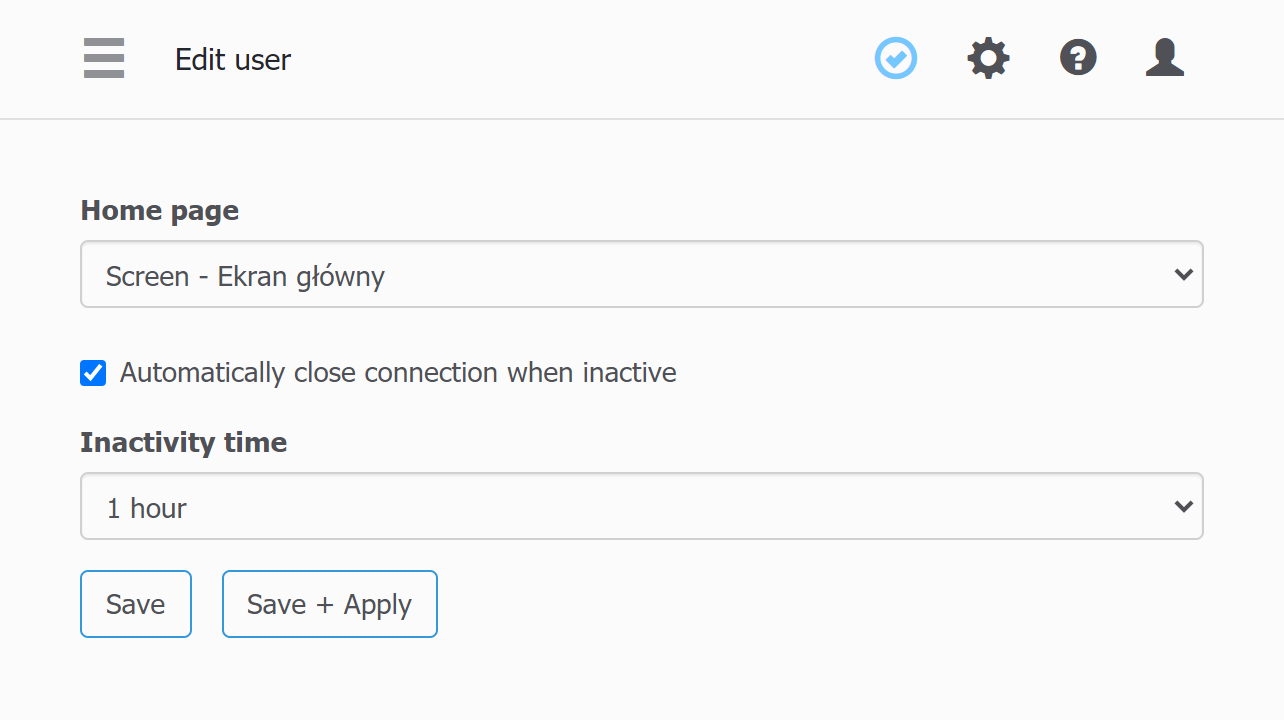
Auto close unattended user session
When working in a “multitasking” mode, most users open and leave “for ever” a lot of open tabs at the same time – this is more practical than constantly opening and closing the same tab. They are often opened from different devices. However, the system continues to exchange data with the browser, even if the user does not look at the page for several days. This subtle “trickle” can become a “stream” in a multiuser system, and also create unnecessary load on the system.
Now, in the user settings, you can set an idle timeout after which the exchange of data with the page will automatically stop and resume after the page is refreshed.
And furthermore:
-
MQTT optimization
-
Portuguese language