
05 Jul New firmware v 3.1 released
A new version of the WebHMI firmware 3.1.5504 has been released.
Main changes:
- Added Polish translation
- Added check of Internet connection and correct local time before updating firmware
- Now WebHMI flushed all data from WAL files to the main SQLite database
- Improved WebHMI log cleanup mechanism
- Fixed minor errors in the work of the Comet technology
- Fixed bug with sorting current alerts in the Alerts dialog
- Grouped TCP connections to the same IP address and port for better work with Modbus TCP gateways
- Added UnitID for Modbus TCP connections to the register table view
- Completely redesigned dashboards editor/viewer
Polish Translation
Thanks to the efforts of our Polish partners Andy Lovberg and Marcin Faszczewski WebHMI received a translation of the interface into Polish. Now customers from Poland can use our product in their native language.
TCP Grouping
We developed new device 7bit Modbus Proxy. This is caching Modbus TCP/RTU gateway. It is equipped with two RS-485 ports, Wi-Fi, two Ethernet ports, two relays. Its main task is to provide a fast and convenient way of polling a large number of slow devices which are using the Modbus RTU protocol.
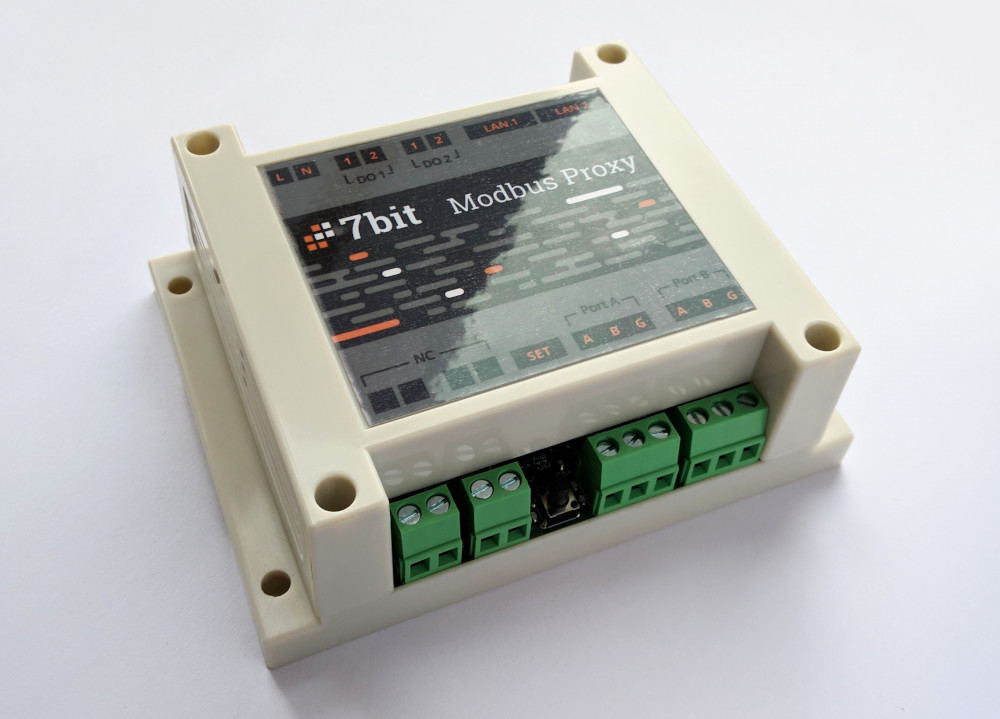
In fact, this is a classic RTU-TCP gateway, but it differs in that it caches all requests and provides last read values very quickly, without waiting for a response from the devices on the slow RS-485 bus. Also it is equipped with Wi-Fi and Ethernet Switch for two ports. This allows you to connect it to the network simply, conveniently even in the most inaccessible places.
The 7bit Modbus Proxy is well suited for the task of dispatching a large number of refrigeration controllers, ventilation controllers and other similar devices. It also allows you to divide one large RS-485 bus into several smaller segments. Thanks to this, the installation of wires for a large object is greatly simplified. Also, one of the side effects of the Modbus Proxy application is the galvanic segmentation of the RS-485 bus. This is useful in cases where individual devices can interfere with each other on the same bus. They can be placed in their own segments and they will no longer degrade the performance of the entire bus.
To optimize operation with the 7bit Modbus Proxy WebHMI now groups TCP connections for all devices with the same IP address/port pair. So only one TCP socket will be open to such a gateway, regardless of the number of UnitIDs that it serves. Earlier, WebHMI opened a separate TCP connection for each UnitID on such gateways.
New Dashboards
The engine for creating/editing/running dashboards was rewritten from scratch. Previously, it relied on individual HTML5 elements to draw all the elements. Now all controls are drawn using the Canvas technology. This allowed us solve many conceptual problems and implement new ideas and opportunities.
Let’s take a short tour of the main differences.
Save and Restore
Previously, users were a little afraid to edit dashboards because all changes were saved immediately and there was no way to undo the last changes.
Now dashboards editing process is not at all dangerous. Your changes do not take effect until you press “Save” button. This allows you not afraid to make changes.
For even more convenience, we added shortcuts Ctrl+Z and Ctrl+Shift+Z. They cancel or repeat the last actions.
The mouse wheel allows you to zoom the dashboard. So, you can zoom up to 4x for more accurate work with smallest elements.
Shortcuts Ctrl+X, Ctrl+C, Ctrl+V works as before. Selection of multiple elements works much better. All elements can now be rotated if needed.
More Dynamics
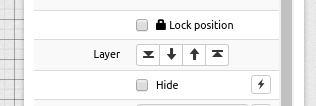
Almost all the controls’ properties can now be changed on the fly in the process of work. Cou can notice new lightning icon nearby such properties:
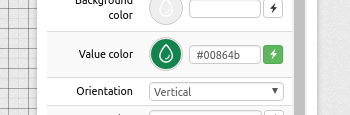
If it is highlighted in green, it means that the administrator has set the rules for changing it and this property has dynamic value. If it is not highlighted then it value is static.
By clicking on this button a Dynamic Value pop-up window opens with settings that determine how to change this property’s value.
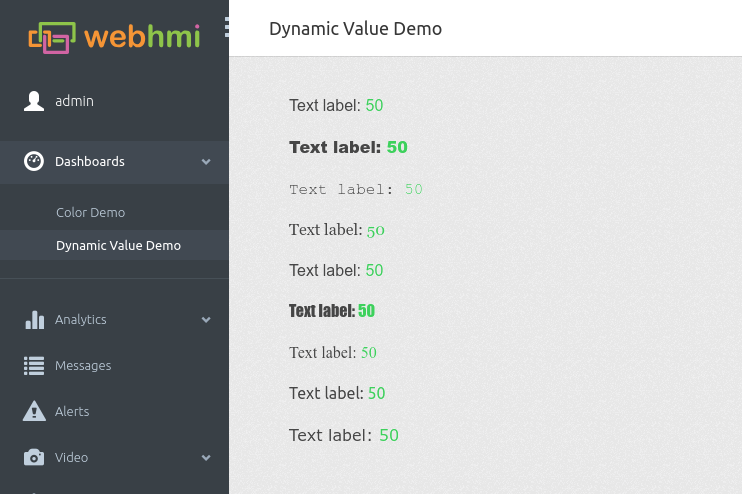
Let’s look at how this works with an example. Let’s say we want to colorize the text in colors that match the state of the register “Demo Register”. In previous firmwares there was a check mark “Colorize” for such behaviour. Now there is no need for this dedicated check box. Let’s see how you can achieve the same effect using new features.
Click on the lightning button near the “Value color” property and select the register in the Dynamic Value pop-up window that will appear, on which the value of this property will depend. In our case, select the register “Demo Register” (D1).

In the “Change property” drop-down list, select “by register’s state”. This means that when the state of the register changes, the value of the property will be replaced in accordance with the new state. Below we will see a list of all possible states and new values for each of them. By default, colors for these states are drawn from the status colors of the selected register, but you can override them here if you want. If you tick the “Blink” checkbox this color will also flash every second getting even more user’s attention.
Now click “Save” to close our pop-up window. That’s all. Now when the state changes, the text color will be changed on the fly. Do not forget to save the dashboard by clicking the “Save” button in the upper right corner of the dashboard editor.
You can also change the properties depending on:
- register values
- range of values of the register
- the value of a particular bit in the register
Similarly, you can assign a value to a property. For example, you can take the value of the register and substitute it in the coordinates of the object. Or, for example, use a script to generate a new color in the register and use its value to paint the background of the object.
Fonts
In all elements that display text, it is possible to set the font and the absolute value of the text size in pixels.
Layers
Earlier we had 5 fixed layers between which all dashboard elements were distributed. Now each element is located on its own layer and can be moved up/down without limits.
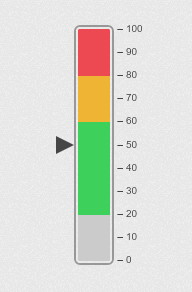
Linear Gauge
The appearance of the Linear Gauge has changed. Previously, only the status zone in which the value of the register is located was displayed in color. Now we display all the status zones so that the operator sees them too.
Ah, yes, a Round Gauge control was added.
Backwards compatibility
Unfortunately, the new engine in the dashboard editor is radically different from the previous version and the old screens will not be compatible with the new version. There is also no easy way to migrate all dashboards to new engine.
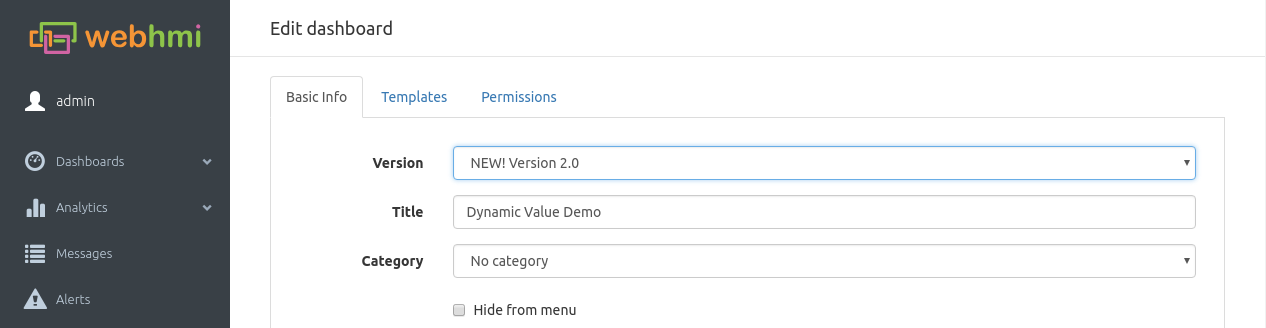
In order that the old projects could work in the new firmware, we left both the new and old engines and the dashboard editors. The version is selected in the settings of each particular dashboard.
So you can import old projects and they will work as before. We plan to support the old editor up to version 4.0 (~1 year ahead). In version 4.0 it will be removed from the firmware. Be aware and prepare your projects in advance.